In this article you can find out:
- How statistics can enhance your essay writing
- How to interpret and present statistics to strengthen your argument
This resource is suitable for broadly discursive essay writing for S1, S2 and S3 (Third and Fourth Level Curriculum for Excellence).
Using statistical evidence

If a writer wants to present a convincing argument, they must do more than state their personal opinions. One way that an argument can be made more informative (and, as a result, more convincing) is by using statistics.
Statistics is the science of collecting, analysing, organising and presenting data. For example:
- '50% of my friends prefer dogs to cats.'
- '22 out of my 30 classmates like pizza.'
- 'Between 2015 and 2020, my local shop's sales decreased by 33%.'
Data can come in a variety of forms such as graphs, charts and diagrams.
A skilful writer will:
- use statistics intelligently to strengthen their point – not to make the point
- have a range of statistical evidence to draw upon
- interpret the evidence to enhance the point that they are making
Example 1: Rugby
The information below relates to the performance of a national rugby team in the Women’s Six Nations:
| Played | 3 |
| Won | 0 |
| Drew | 0 |
| Lost | 3 |
(These statistics have been imagined for the purpose of this exercise.)
How would you use these statistics to argue that the team performed poorly?

If you want to argue that the team performed poorly, you could say:
The team’s performance was below par throughout this Six Nations competition. This is evidenced by the fact the team played 3 games and lost 3 games.
But that doesn’t feel all that convincing an argument.
If you change the way you present data by turning it into a percentage, you can add strength to your argument. For example:
The team’s performance was below par throughout this Six Nations competition. This is evidenced by the fact that the team lost 100% of the matches played.
Interpreting statistics like this is a simple but very effective way to add strength to your arguments in an essay. It also demonstrates that you have understood the data or information from your research and presented it in an accurate way.
Example 2: Football
The information below relates to a national football team’s performance over the course of one season:
| Played | 207 |
| Won | 93 |
| Goals | 371 |
(These statistics have been imagined for the purpose of this exercise.)

Imagine that you want to argue that the national team’s defence is terrible.
How could you interpret the statistics above to support that point? You might have to engage some numeracy skills here.
Here is an example of how you could interpret these statistics to support your point:
There is no question that the national team’s failure lies in its shoddy defending. This season, the team played 207 games, scoring 371 goals. On average, the team scored 1.7 goals per game. This is a great scoring record for any team. So why do they keep losing? It has to be the fault of the defenders, who are conceding goals at a greater rate than the team’s strikers can score.
Example 3: Health
Imagine you are writing a persuasive essay about the impact of obesity on hospital admissions..
Which of these statements has more persuasive force? Which is more convincing?
- In 2015 and 2016, hospital admissions directly linked to obesity cost the NHS a lot of money.
- According to a study by The Scottish Public Health Observatory, the cost of hospital admissions attributable to overweight and obesity in 2015 to 2016 was £117 million. (‘The impact of overweight and obesity on hospital resource use (hospital episodes) in Scotland’, NHS Health Scotland/ScotPHO, September 2018).
Sentence one
'In 2015 and 2016, hospital admissions directly linked to obesity cost the NHS a lot of money.'
Sentence one seems vague. How much exactly is a ‘a lot of money’? Where has the writer found this information? Is the information reliable?
Sentence two
'According to a study by The Scottish Public Health Observatory, the cost of hospital admissions attributable to overweight and obesity in 2015 to 2016 was £117 million. (‘The impact of overweight and obesity on hospital resource use (hospital episodes) in Scotland’, NHS Health Scotland/ScotPHO, September 2018).'
Sentence two, on the other hand, gives more specific detail. Seeing the number rendered on the page gives us a real sense of the financial cost involved and scale of the problem.
Additionally, this sentence cites where this information comes from – a publication from The Scottish Public Health Observatory. This assures the reader that the information is robust and factually accurate.
Try it yourself
Imagine that you are writing a persuasive essay on the impact of remote learning on young people’s mental health.
You decide to use the results of a Newsround survey called ‘Coronavirus and UK kids’.
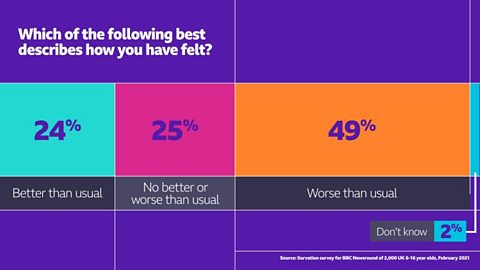
Take a look at the statistics below:
"A third of children said the schooling they received at home was better than usual, while 16% said it was the same. But half (50%) said it was worse than being in school. Girls (52%) and younger children were most disappointed (53%).
Experiences may also have been different depending on where children went to school. In London, 38% of pupils said remote learning was better than going to school in person, compared to 27% in Scotland. In fact, almost six out of 10 pupils (58%) in Scotland said remote learning was worse than going to school in person."
(Source: Survation survey for ±´”„tv Newsround of 2,000 UK 6-16 years olds, February 2021)
Which statistics could you use to support the points below?
- A significant number of children responded that they enjoyed home schooling more that in person.
- Scottish learners seem to really value in-person learning.
- Some learners were not greatly affected by the switch to online learning.
Develop your data analysis skills. list
Revise how to interpret, present and describe data with 3rd level Maths and Numeracy guides.

More on Discursive, persuasive and informative writing
Find out more by working through a topic
- count7 of 9

- count8 of 9

- count9 of 9

- count1 of 9