Data analysis
Data handling
It is important to make sure any information you work with is robust. Things to look out for include validity of the source, scale used, sample size, method of presentation and appropriateness of how the sample was selected.
Collecting and recording data
When carrying out an investigation, you will need to collect and record data from which you can draw conclusions.

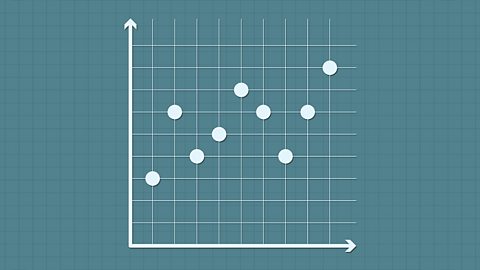
Presenting data - graphs, charts and diagrams
Statistical information can be presented in diagrams, graphs and charts. The type you use will largely depend on the sort of data that you want to present.
Interpreting and describing data
Data is presented in different ways across diagrams, charts and graphs. These can be studied to find specific information or to identify patterns, known as trends, in whole groups of data. These findings can then be summarised and described in words.

Video playlist
Ink colours for printing. Video
An introduction to the four main colours of ink required to print a magazine.