Key points
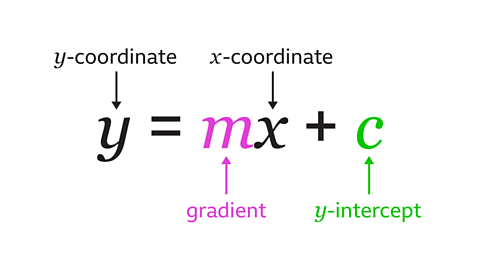
A Describing an expression of the form ØÆéØÆÖ┬▓ + ØÆāØÆÖ + ØÆä where ØÆé, ØÆā and ØÆä are real numbers. ØÆÜ = ØÆéØÆÖ┬▓ + ØÆāØÆÖ + ØÆä is a quadratic equation, its graph is a parabola. graph is a visual representation of a quadratic equation in the form \(y = ax┬▓ + bx + c\) where the A number or symbol multiplied with a variable or an unknown quantity in an algebraic term. Eg, 5 is the coefficient of 5ØÆÅ \(a\) and \(b\) are Integers are numbers with no fraction or decimal part. They can be positive, negative or zero. 42, 8, and 10000 are examples of integers., and \(c\) is a The number or quantity that does not vary. Eg, in the equation ØÆÜ = 3ØÆÖ + 6, the 3 and 6 are constants, where ØÆÖ and ØÆÜ are variables. .
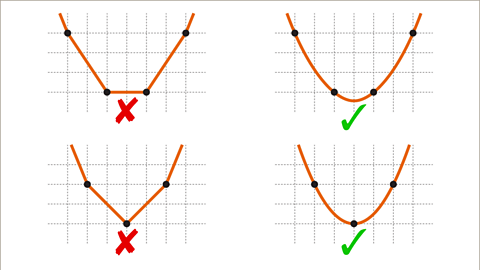
A linear graph can be drawn using only three points. A quadratic graph is a curve, so more points are plotted to support accuracy.
The shape of a quadratic graph is called a The shape of a quadratic graph., which looks like a U-shape. When the \(x┬▓\) term is positive the graph is U-shaped. When \(x┬▓\) is negative the graph is šł-shaped. The graph has a vertical line of symmetry.
Understanding how to substitute values into an expression is an essential skill when using graphs to estimate values of \(x\) and \(y\).
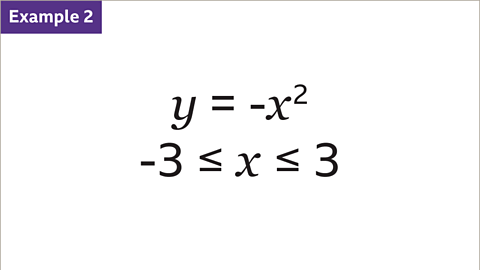
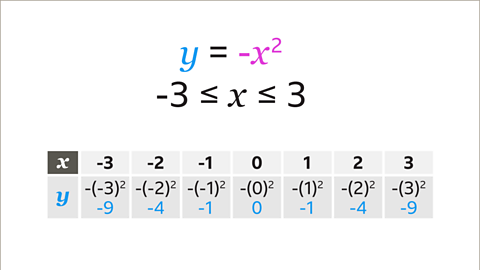
How to draw the graphs ØÆÜ = ØÆÖ┬▓ and ØÆÜ = -ØÆÖ┬▓
There are no straight-line segments on a quadratic graph. The coordinates \((x, y)\) are plotted and joined by drawing a freehand curve.
- Two consecutive horizontal points are joined by a rounded curve.
- A single point is rounded off to avoid a pointed turn.
To draw the graph \(y = x┬▓\):
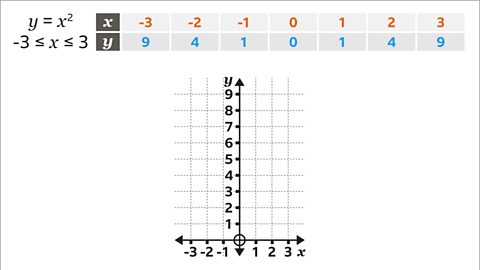
Set up a table of values for \(x\) and \(y\), using the given values of \(x\)
Find the values for \(y\)
- For \(y = x┬▓\), work out \(x┬▓\) (which is \(x\) multiplied by itself).
- For \(y = -x┬▓\), work out \(-x┬▓\) (which is the negative value of \(x┬▓\)).
Draw and label the axes to include the minimum and maximum values of \(x\) and \(y\).
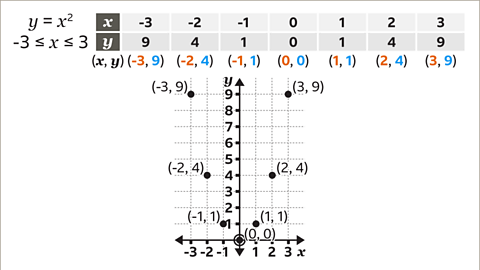
The coordinates \((x, y)\) are read from the table and plotted on the axes.
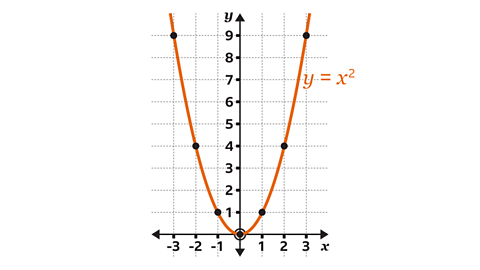
Join the points, drawing a freehand curve through the points.
Label the graph.
Examples

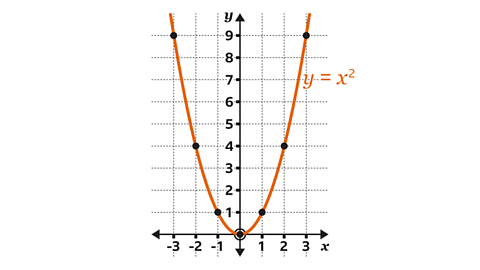
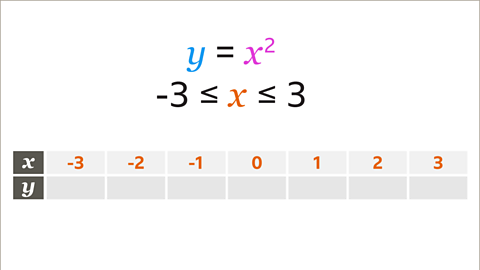
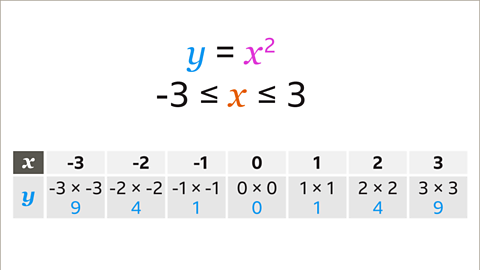
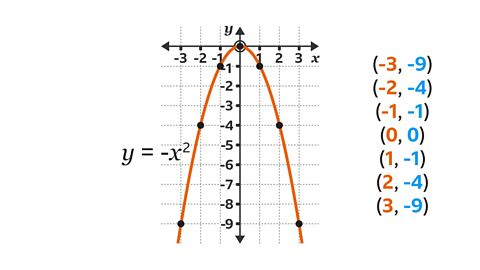
Image caption, Draw the graph of the quadratic equation ØÆÜ = ØÆÖ┬▓ for values of ØÆÖ from -3 to 3. This is shown by the inequality -3 Ōēż ØÆÖ Ōēż 3
1 of 10
Question
Which graph, A, B or C, shows \(y = x┬▓\)?
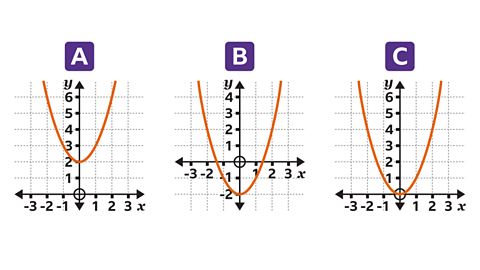
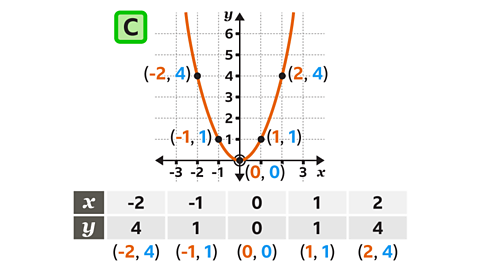
Graph C is \(y = x┬▓\). For each value of \(x\) the value of \(y\) is \(x┬▓\)
- The integer values of \(x\) that can be seen are -2, -1, 0, 1 and 2
- The values of \(y\) (\(x┬▓\)) are 4, 1, 0, 1 and 4
- The integer coordinates (\(x, y\)) are (-2, 4), (-1, 1), (0, 0), (1, 1) and (2, 4)
Graph A is \(y = x┬▓ +2\)
Graph B is \(y = x┬▓ ŌĆō 2\)
How to draw a quadratic graph from a table of values
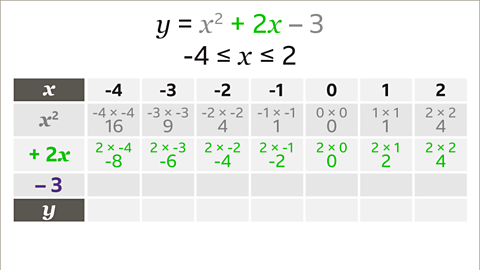
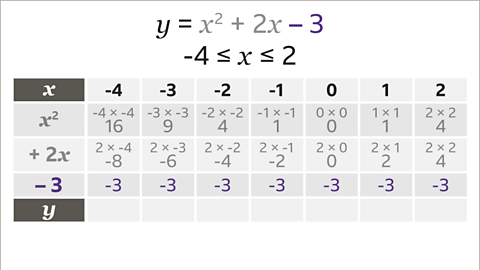
A quadratic equation in the form \(ax┬▓ + bx + c\) combines several An element within an algebraic sentence. Elements (terms) are separated by + or - signs. .
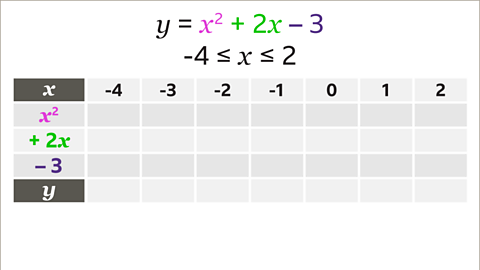
A table of values is used to find the points to plot for a graph. A row is used for each term in the equation to work out the coordinates.
To draw a quadratic graph from an equation:
- Set up a table of values using the given values of \(x\)
- Use additional rows in the table to work out each term in the quadratic equation.
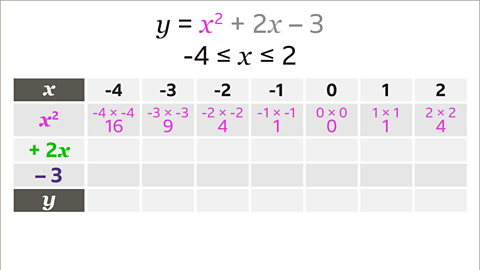
- Substitute the values of \(x\) to evaluate each term, a row at a time.
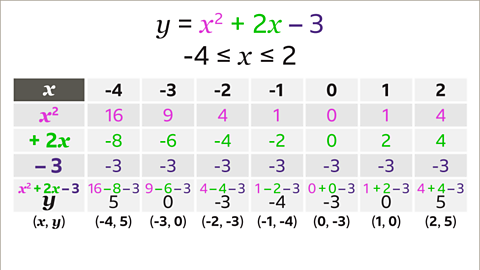
- Add up the terms of the quadratic expression, a column at a time, to find the value of \(y\)
- Draw and label the axes to include the minimum and maximum values of \(x\) and \(y\)
- Read the coordinates (\(x, y\)) from the table and plot on the axes.
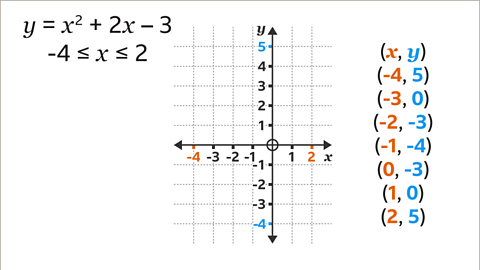
- Join the points, drawing a freehand curve through the points.
- Label the graph.
Example
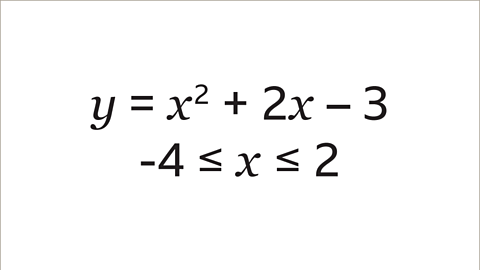
Image caption, Draw the graph of the quadratic equation ØÆÜ = ØÆÖ┬▓ + 2ØÆÖ ŌĆō 3 for values of ØÆÖ from -4 to 2. This is shown by the inequality -4 Ōēż ØÆÖ Ōēż 2
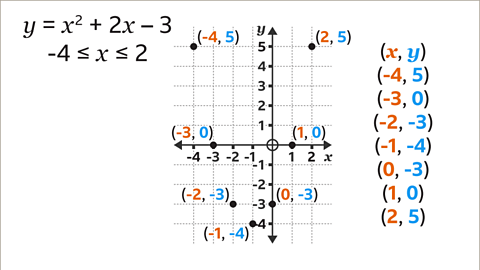
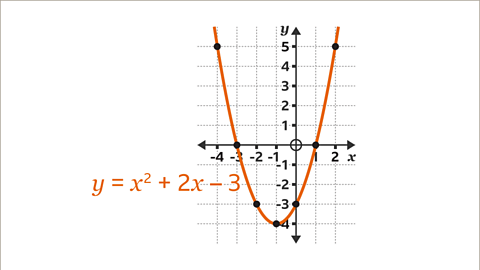
1 of 9
Questions
Question 1:
Complete the table for \(y = x┬▓ ŌĆō 4x + 5\) for values of \(x\) from ŌĆō1 to 3
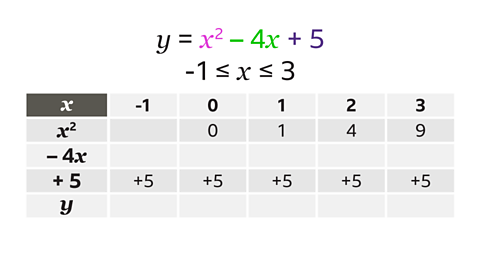
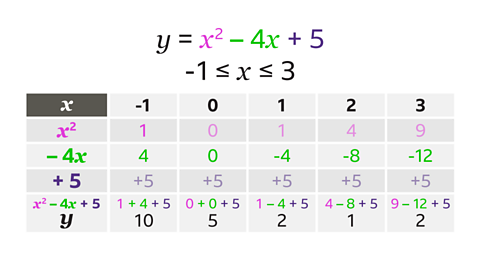
In the \(x┬▓\) row, (-1)┬▓ is the missing value. This is -1 ├Ś -1 = 1
The entire -4\(x\) row must be completed. This is -4 multiplied by each \(x\) value.
- When \(x\) = -1, -4\(x\) = -4 ├Ś ŌĆō1, -4\(x\) = 4
- When \(x\) = 0, -4\(x\) = -4 ├Ś 0, -4\(x\) = 0
- When \(x\) = 1, -4\(x\) = -4 ├Ś 1, -4\(x\) = -4
- When \(x\) = 2, -4\(x\) = -4 ├Ś 2, -4\(x\) = -8
- When \(x\) = 3, -4\(x\) = -4 ├Ś 3, -4\(x\) = -12
The \(y\)-coordinates are found by adding together the terms \(x┬▓\), -4\(x\) and + 5
- When \(x\) = -1, \(y\) = 1 + 4 + 5, \(y\) = 10
- When \(x\) = 0, \(y\) = 0 + 0 + 5, \(y\) = 5
- When \(x\) = 1, \(y\) = 1 ŌĆō 4 + 5, \(y\) = 2
- When \(x\) = 2, \(y\) = 4 ŌĆō 8 + 5, \(y\) = 1
- When \(x\) = 3, \(y\) = 9 ŌĆō 12 + 5, \(y\) = 2
Question 2:
Complete the table for \(y = 2x┬▓ + 3x ŌĆō 4\) for values of \(x\) from ŌĆō2 to 2
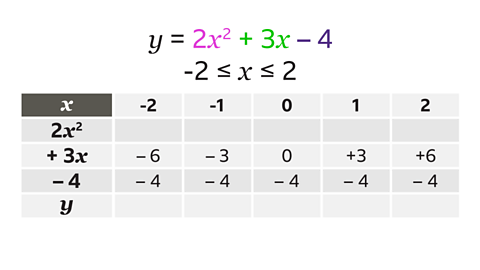
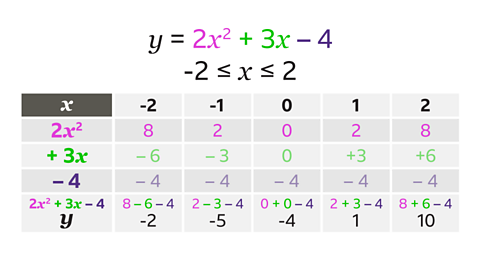
The entire \(2x┬▓\) row must be completed. This is 2 multiplied by each \(x┬▓\) value.
- When \(x =\) -2, \(2x┬▓ =\) 2 ├Ś (-2)┬▓, \(2x┬▓ = 8\)
- When \(x =\) -1, \(2x┬▓ =\) 2 ├Ś (-1)┬▓, \(2x┬▓ = 2\)
- When \(x =\) 0, \(2x┬▓ =\) 2 ├Ś 0┬▓, \(2x┬▓ = 0\)
- When \(x =\) 1, \(2x┬▓ =\) 2 ├Ś 1┬▓, \(2x┬▓ = 2\)
- When \(x =\) 2, \(2x┬▓ =\) 2 ├Ś 2┬▓, \(2x┬▓ = 8\)
The \(y\)-coordinates are found by adding together the terms \(2x┬▓\), \(+3x\) and -4
- When \(x =\) -2, \(y = 8 ŌĆō 6 ŌĆō 4\), \(y =\) -2
- When \(x =\) -1, \(y = 2 ŌĆō 3 ŌĆō 4\), \(y =\) -5
- When \(x =\) 0, \(y = 0 + 0 ŌĆō 4\), \(y =\) -4
- When \(x =\) 1, \(y = 2 + 3 ŌĆō 4\), \(y =\) 1
- When \(x =\) 2, \(y = 8 + 6 ŌĆō 4\), \(y =\) 10
Use a quadratic graph to estimate values of ØÆÖ and ØÆÜ
A quadratic graph can be used to find an estimate of the value of \(x\) from a given value of \(y\), or the value of \(y\) from a given value of \(x\)
A value of \(x\) will give one \(y\)-value.
A value of \(y\) will give two possible values of \(x\) because a quadratic graph is symmetrical.
To find a \(y\)-value from a given \(x\)-value:
- On the \(x\)-axis, locate the given amount.
- Draw a vertical line, using a ruler, from the given amount to the curve.
- Draw a horizontal line, using a ruler, from the curve across to the \(y\)-axis.
- Read the value on the \(y\)-axis.
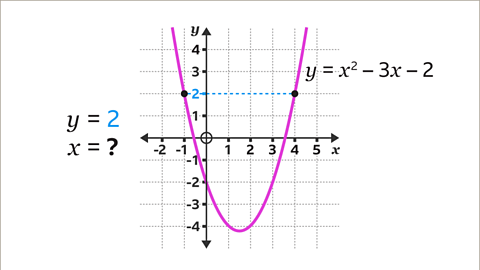
To find an \(x\)-value from a given \(y\)-value:
- On the \(y\)-axis, locate the given amount.
- Draw a horizontal line, using a ruler, from the given amount across to the curve. It will cross the curve in two places.
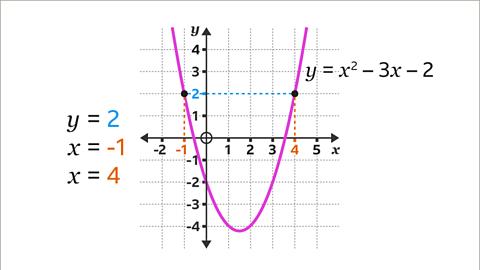
- Draw a vertical line, using a ruler, from the curve down to the \(x\)-axis.
- Read the values on the \(x\)-axis.
Examples
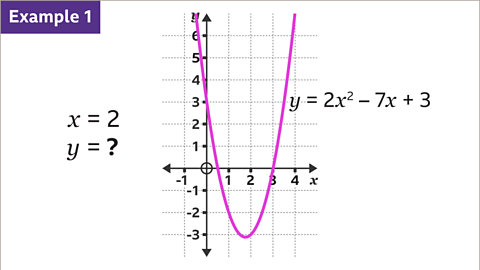
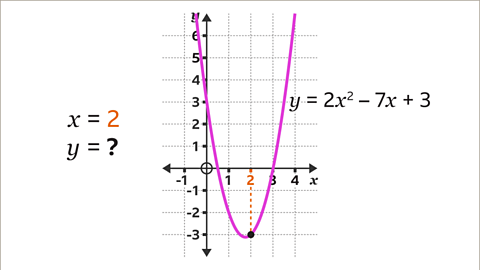
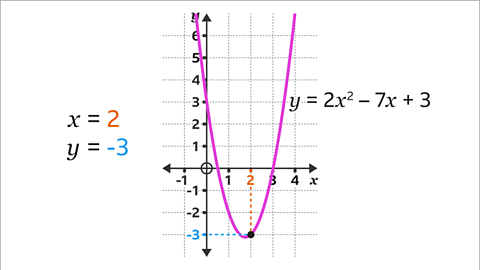
Image caption, Use the graph of ØÆÜ = 2ØÆÖ┬▓ ŌĆō 7ØÆÖ + 3 to find the value of ØÆÜ when ØÆÖ = 2
1 of 6
Question
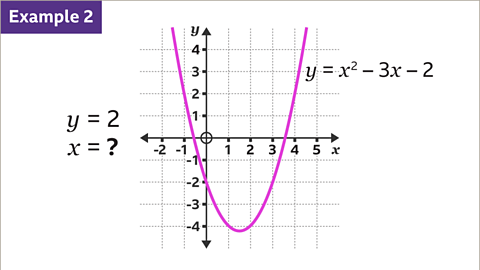
Use the graph of \(y = 3 + 4x ŌĆō x┬▓\) to find the values of \(x\) when \(y = 3\)
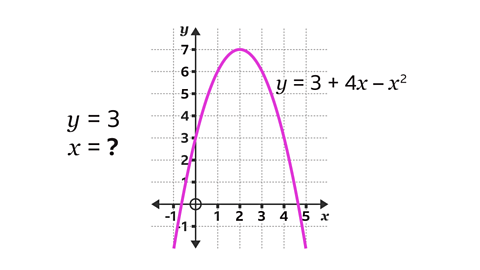
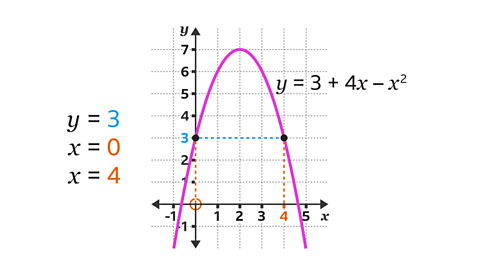
On the \(y\)-axis, locate the given value of \(y\) (3).
Draw a horizontal line, using a ruler, from 3 on the \(y\)-axis across to the curve. It will cross the curve in two places.
Draw vertical lines, using a ruler, from the curve down to the \(x\)-axis.
Read the values on the \(x\)-axis. When \(y\) = 3, \(x\) = 0 and \(x\) = 4
Practise reading and plotting quadratic graphs
Quiz
Practise reading and plotting quadratic graphs with this quiz. You may need a pen and paper to help you with your answers.
Real-life maths
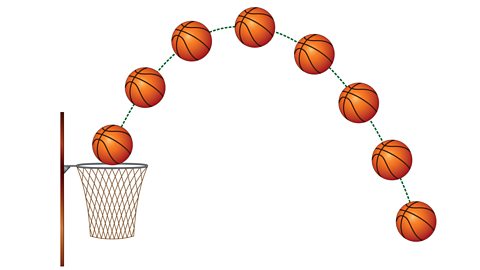
A parabola is the shape of a quadratic graph.
Understanding this shape can be helpful to many types of sports athletes. An object thrown or kicked through the air will create a parabola.
A netball or basketball player could create digital quadratic graphs to analyse their shooting technique, for example. A rugby or football player could do the same when practising conversions or free kicks.
Doing this can help sports players adjust their throws or kicks and improve their accuracy.
Game - Divided Islands
Play the Divided Islands game! game
Using your maths skills, help to build bridges and bring light back to the islands in this free game from ▒½ėŃtv Bitesize.

More on Graphs
Find out more by working through a topic
- count1 of 7
- count2 of 7
- count3 of 7
- count4 of 7