Key points

- Understanding how to plot points in all four quadrants is essential for drawing linear (straight-line) graphs and quadratic graphs.
- The \(x\)The line on a graph that runs horizontally (left-right) through the origin. It is used as a reference to measure from. is The right-left direction on a graph or map. Parallel to the horizon., labelled with positive values to the right of the The position (0, 0) where ùíô = 0 and ùíö = 0 and negative values to the left of the origin.
- The \(y\)The line on a graph that runs vertically (up-down) through the origin. It is used as a reference to measure from. is The up-down direction on a graph or map., labelled with positive values going up from the origin and negative values going down from the origin.
- The axes Where lines cross or overlap. at the origin (0, 0), dividing the The area for fixing positions using coordinates. into The four areas that make up the coordinate plane.. Coordinates can be plotted using both positive and negative values.
Understanding the four quadrants of a graph
When the \(x\)-axis and the \(y\)-axis intersect they create four quadrants. The point at which they cross is the origin. The \(x\)-axis is horizontal. The \(y\)-axis is vertical.
The Two reference lines, one horizontal and one vertical, that cross at right-angles. They are used to define the position of a point on a grid. Axes is the plural of axis. are labelled with numbers regularly spaced from the origin, aligned with the gridlines. The The regular intervals of how values increase on each axis. on the axes do not need to be the same.
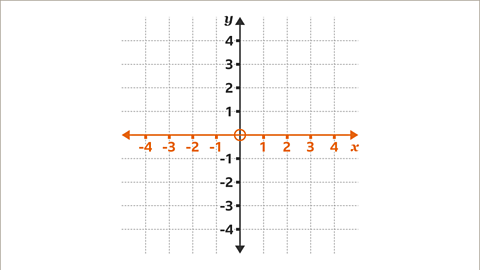
- The \(x\)-axis is labelled with positive numbers increasing to the right and negative numbers decreasing to the left of the origin.
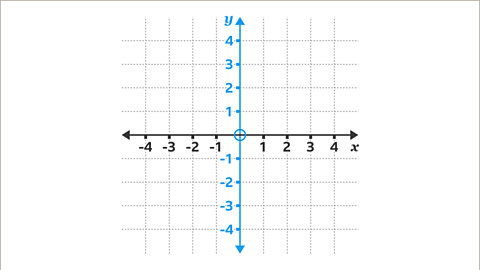
- The \(y\)-axis is labelled with positive numbers increasing up and negative numbers decreasing down from the origin.
Understanding axes and coordinates is necessary when drawing and using axes in four quadrants. Inequality statements may be used to describe the range of values for each axis.
Examples
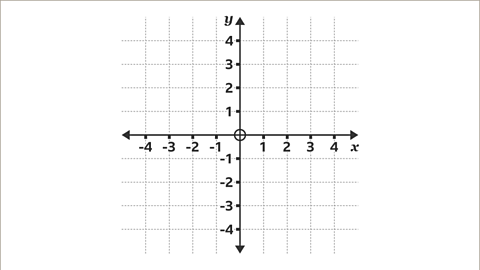
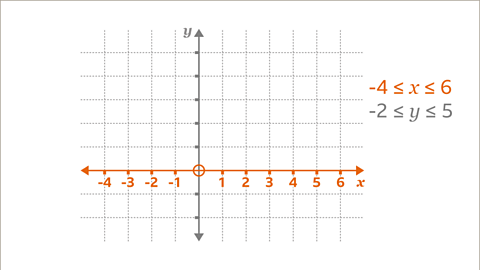
Image caption, When the horizontal ùíô-≤π≥Êæ±≤ı and the vertical ùíö-≤π≥Êæ±≤ı intersect, they create four quadrants.
1 of 9
Question
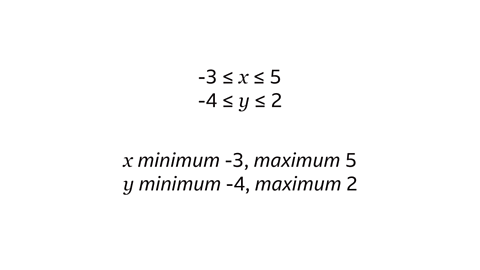
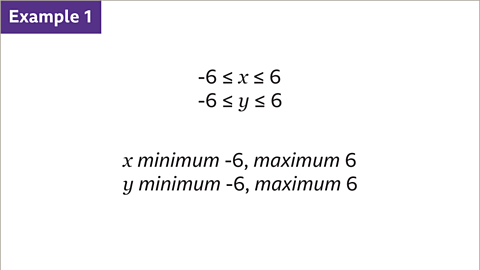
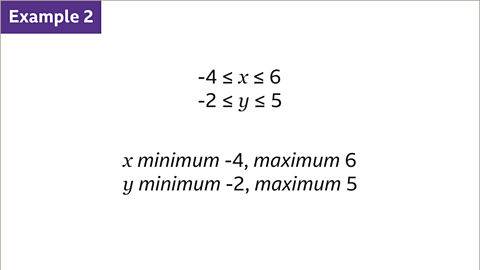
Draw a pair of axes for the given \(x\) and \(y\) values.
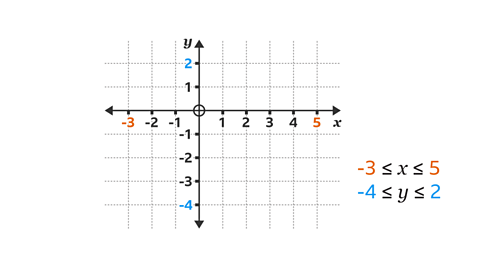
The inequalities are –3 ≤ \(x\) ≤ 5 and –4 ≤ \(y\) ≤ 2
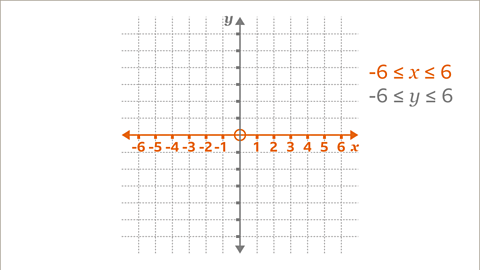
Draw the horizontal \(x\)-axis, labelling it from the origin with positive values increasing to the right to 5 and negative numbers decreasing to the left to -3
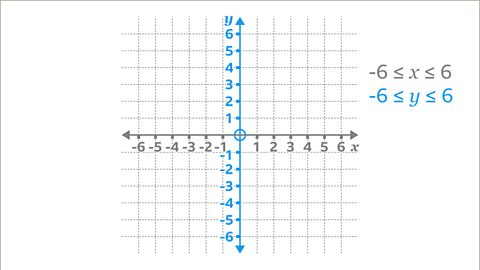
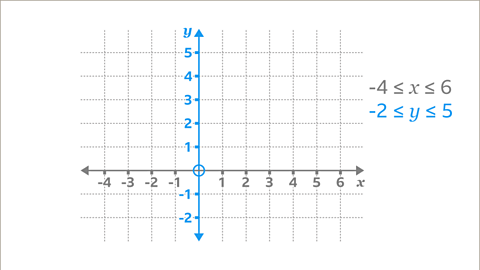
Draw the vertical \(y\)-axis, labelling it from the origin with positive numbers increasing upwards to 2 and negative numbers decreasing downwards to -4
Plotting points in all four quadrants
The four quadrants allow The ordered pair of numbers (ùíô, ùíö) that defines the position of a point is the coordinate pair (or the coordinates.) with negative and positive values to be plotted.
- The notation (\(x\), \(y\)) gives a position on a coordinate plane.
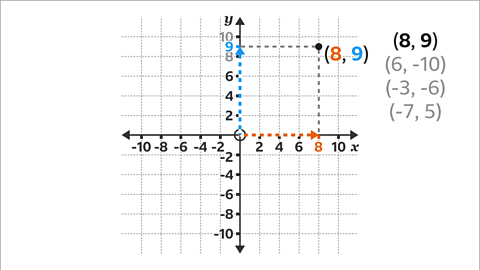
- The first coordinate value represents \(x\). This is a horizontal movement from the origin.
- The second coordinate value represents \(y\). This is a vertical movement from the origin.
- The result of the \(x\) and \(y\) movements gives the position of the point that is plotted on the axes.
Example
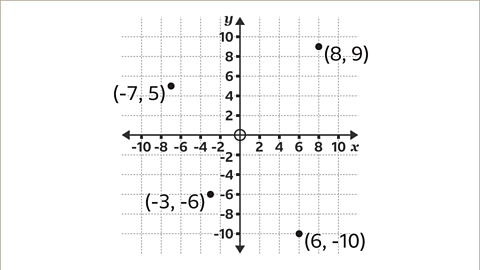
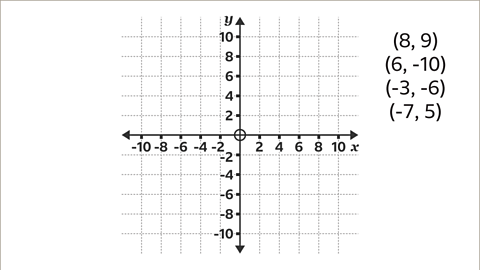
Image caption, The four quadrants allow coordinates with negative and positive values to be plotted.
1 of 6
Question
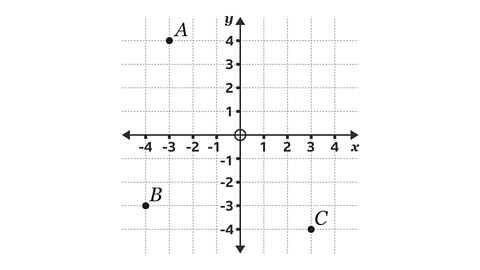
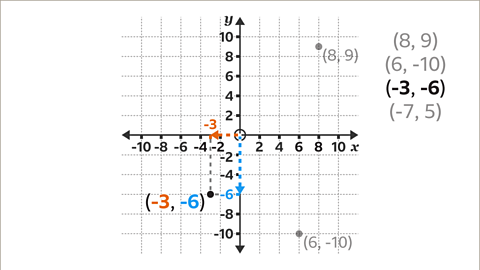
Which of the three points has the coordinates (3, -4)?
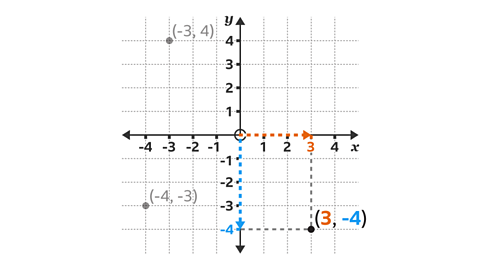
Point \(C\) has coordinates (3, -4).
\(x\) = 3 and \(y\) = -4
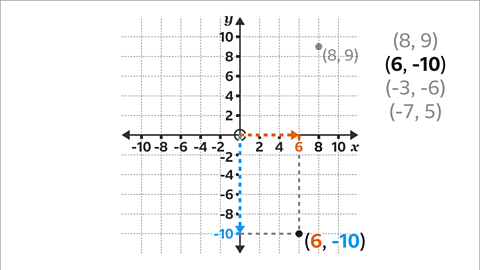
Starting at the origin, move 3 steps to the right on the \(x\)-axis to 3 and then 4 steps down the \(y\)-axis to -4
Practise using the four quadrants
Quiz
Practise reading and plotting across the four quadrants. You may need a pen and paper to help you with your answers.
Real-life maths
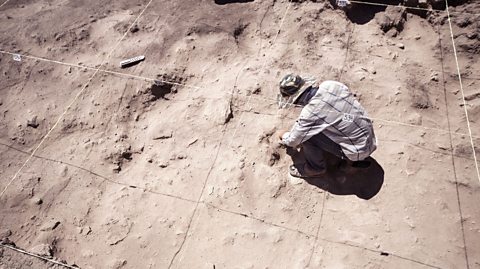
Archaeologists use coordinate grids to help them Uncover or expose buried items by digging and removing the earth from around them carefully. items and artefacts from the past and to locate important features.
A secure reference point is used as the origin (0, 0). A grid is measured out with string guidelines over the grid site to help map the location of items as they are found and excavated.
Setting up a grid system like this is essential to have accurate information during an archaeological dig.

The \(x\) and \(y\) axes work on a two-dimensional (2D) plane. Coordinates in three-dimensional (3D) space are used in Computer-Aided Design (CAD) programs.
These allow users to create 3D images. CAD is used by game programmers, software engineers and in the development of film animation.
Game - Divided Islands
Play the Divided Islands game! game
Using your maths skills, help to build bridges and bring light back to the islands in this free game from ±´”„tv Bitesize.

More on Graphs
Find out more by working through a topic
- count3 of 7
- count4 of 7
- count6 of 7