Key points
Graphs of two or more straight lines can be used to solve simultaneous linear equations.
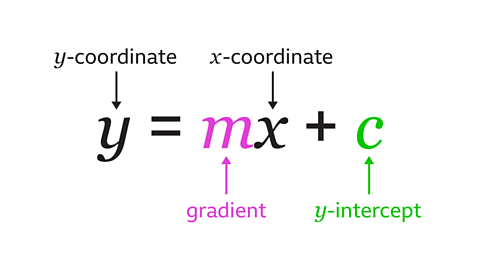
The graph of a straight line can be described using an A mathematical statement showing that two expressions are equal. The expressions are linked with the symbol =.
- The right-left direction on a graph or map. Parallel to the horizon. lines are written as \(y = c\)
- The up-down direction on a graph or map. lines are written as \(x = c\)
- A line that is slanted, neither horizontal nor vertical. are written as \(y = mx + c\)
\(m\) is a number which is a measure of the steepness of the line. This is the A measure of the slope of a line. The steeper the line, the greater the gradient. The gradient is represented by ùíé in the equation ùíö = ùíéùíô + ùíÑ.
\(c\) is the number where the line crosses the \(y\)-axis. This is the \(y\)The point at which the line crosses the ùíö-axis. Commonly referred to as 'the intercept'..
The The ordered pair of numbers (ùíô, ùíö) that defines the position of a point. of the points on an oblique line are calculated by In algebra substitute means to replace a letter (or variable) with a number. given values of \(x\) into the equation \(y = mx + c\)
Recognise and draw the lines ùíö = ùíô and ùíö = -ùíô
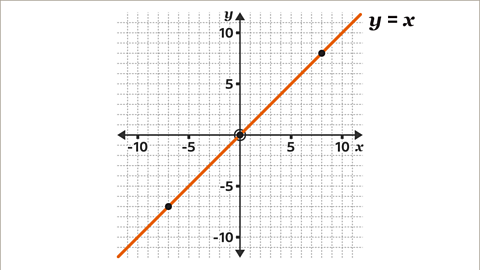
All the points on the line \(y = x\) have coordinates with equal values for \(x\) and \(y\)
- To draw the line \(y = x\):
- Plot points with coordinates where \(x\) and \(y\) are equal. Three points are sufficient, but more can be plotted.
- Draw a line through the plotted points.
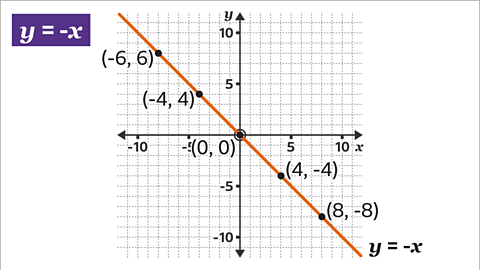
All the points on the line \(y = -x\) have coordinates with values for \(x\) and \(y\) that are equal in Size. but with opposite signs.
If \(x\) is positive, \(y\) is negative. If \(x\) is negative, \(y\) is positive.
- To draw the line \(y = -x\):
- Plot points with coordinates where \(x\) and \(y\) have equal magnitude but opposite signs.
- Draw a line through the plotted points.
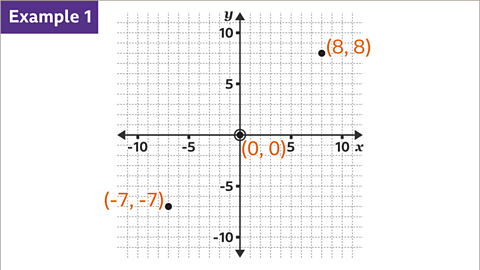
Examples
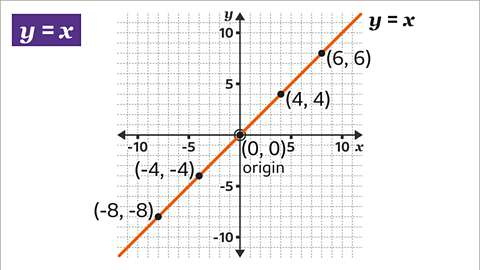
Image caption, The straight line ùíö = ùíô passes through the origin. All the points on the line ùíö = ùíô have coordinates with equal values for ùíô and ùíö

1 of 6
Question
One graph shows \(y = x\) and one shows \(y = -x\). Which graph shows \(y = x\)?
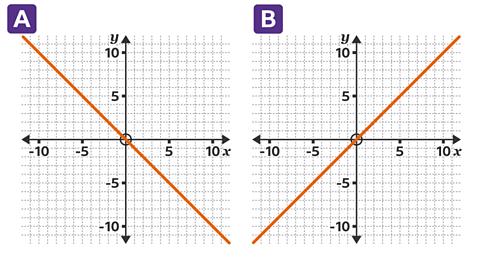
Graph B is \(y = x\).
All the coordinates have equal values for \(x\) and \(y\). This is shown by the points on the line such as (10, 10) and (-4, -4).
Graph A is \(y = -x\). All the coordinates have \(x\) and \(y\) values that are equal in magnitude but with opposite signs.
This is shown by the points on the line, such as (-6, 6) and (10, -10).

Draw the graph ùíö = ùíéùíô + ùíÑ by creating a table of values
\(m\) is a number which measures the steepness of the line. This is known as the gradient.
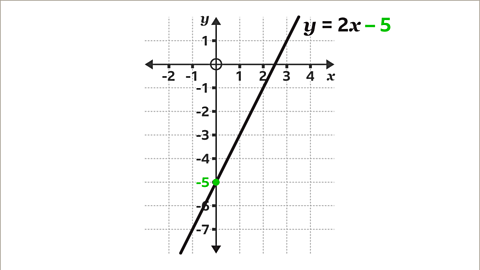
\(c\) is the number where the line crosses the \(y\)-axis. This is the \(y\)-intercept.
- To draw a graph of \(y = mx + c\) for given values of \(x\):
- Use the given values for \(x\) to draw a table of values for \(x\) and \(y\)
- In algebra substitute means to replace a letter (or variable) with a number. each value of \(x\) into the equation to find the valueof \(y\). Each pair of values give a coordinate.
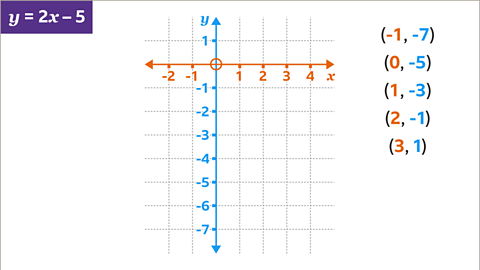
- Use the coordinates to decide on Two reference lines, one horizontal and one vertical, that cross at right-angles. They are used to define the position of a point on a grid. Axes is the plural of axis. that will take all the values of \(x\) and \(y\)
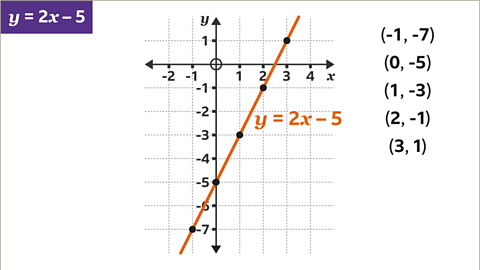
- Plot the coordinates and draw a line through the points. Label the line with the equation.
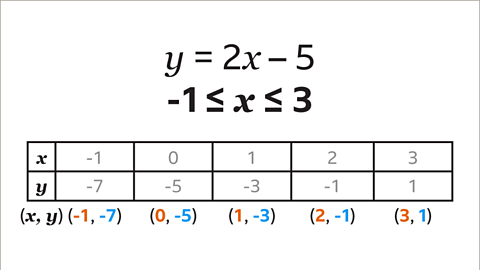
Example
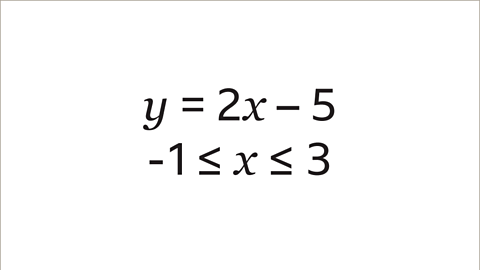
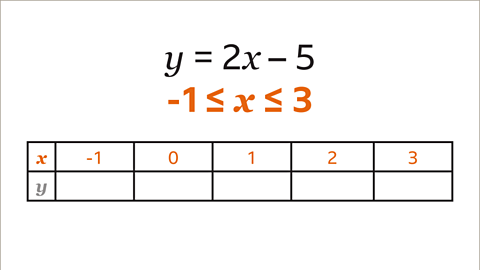
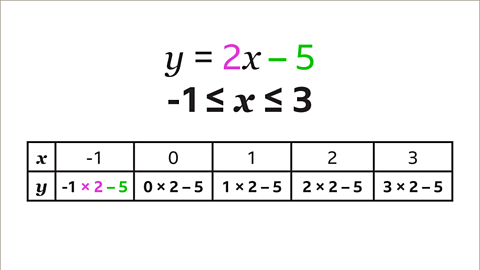
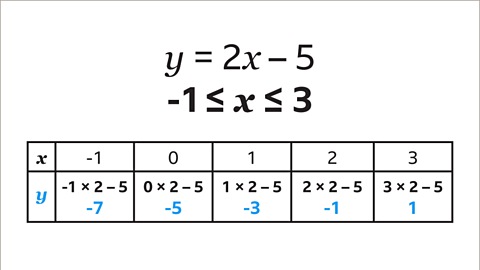
Image caption, Draw the graph of ùíö = 2ùíô ‚Äì 5 for values of ùíô from -1 to 3. This is written as the inequality -1 ‚⧠ùíô ‚⧠3

1 of 9
Questions
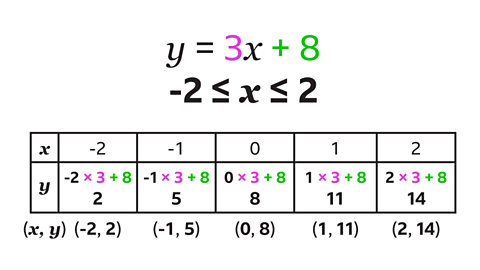
Question 1: Complete the table of values for \(y = 3x + 8\) for values of \(x\) from -2 to 2
To find the values of \(y\), each value of \(x\) is multiplied by 3 and 8 is added on.
- When \(x\) is -2, the calculation is -2 √ó 3 + 8. The value of \(y\) is 2
- When \(x\) is -1, the calculation is -1 √ó 3 + 8. The value of \(y\) is 5
- When \(x\) is 0, the calculation is 0 √ó 3 + 8. The value of \(y\) is 8
- When \(x\) is 1, the calculation is 1√ó 3 + 8. The value of \(y\) is 11
- When \(x\) is 2, the calculation is 2 √ó 3 + 8. The value of \(y\) is 14
The coordinates for \(y = 3x + 8\), given by the table, are
(-2, 2), (-1, 5), (0, 8), (1, 11), and (2, 14).
A table of values can also be used to find the coordinates of a line with a negative gradient.
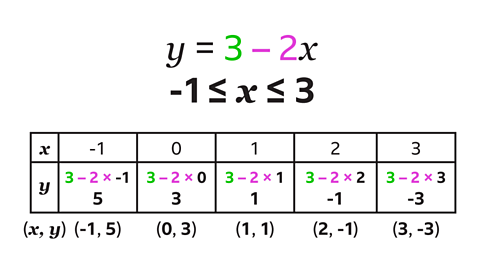
Question 2: Complete the table of values for \(y = 3 – 2x\) for values of \(x\) from -1 to 3
To find the values of \(y\), each value of \(x\) is multiplied by 2 and the result subtracted from 3
- When \(x\) = -1 the calculation is 3 – 2 × -1. The value of \(y\) is 5
- When \(x\) = 0 the calculation is 3 – 2 × 0. The value of \(y\) is 3
- When \(x\) = 1 the calculation is 3 – 2 × 1. The value of \(y\) is 1
- When \(x\) = 2 the calculation is 3 – 2 × 2. The value of \(y\) is -1
- When \(x\) = 3 the calculation is 3 – 2 × 3. The value of \(y\) is -3
The coordinates for \(y = 3x + 8\), given by the table, are
(-1, 5), (0, 3), (1, 1), (2, -1), and (3, -3).
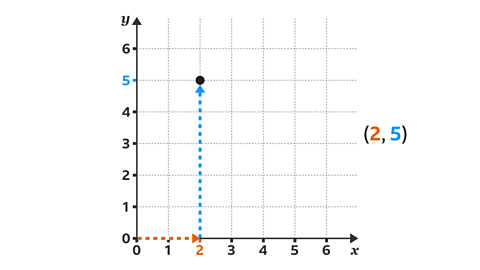
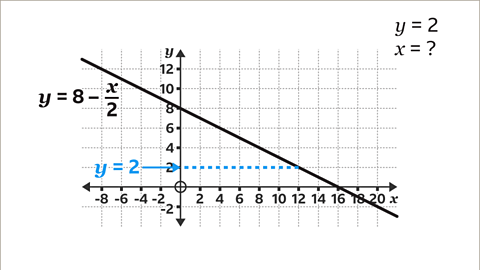
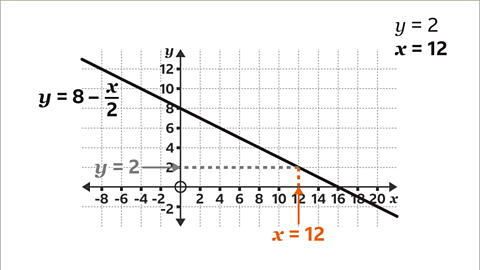
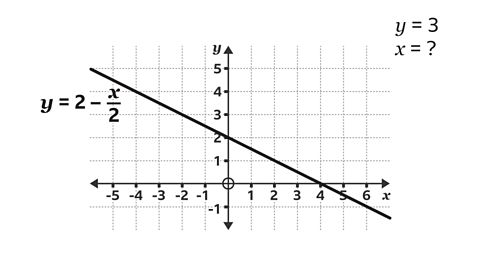
Reading ùíô and ùíö coordinates from a graph
A position on a graph is defined by coordinates (\(x\), \(y\)). When one coordinate is given, the second can be read from the graph.
To find a \(y\)-coordinate from a given \(x\)-coordinate:
- On the \(x\)-axis, locate the given amount.
- Draw a vertical line, using a ruler, from the given amount up to the line.
- Draw a horizontal line, using a ruler, from the line across to the \(y\)-axis.
- Read the value on the \(y\)-axis.
To find an \(x\)-coordinate from a given \(y\)-coordinate:
- On the \(y\)-axis, locate the given amount.
- Draw a horizontal line, using a ruler, from the given amount across to the line.
- Draw a vertical line, using a ruler, from the line down to the \(x\)-axis.
- Read the value on the \(x\)-axis.
Examples
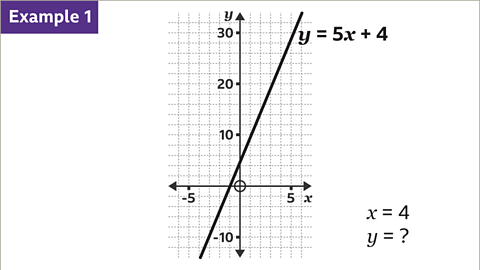
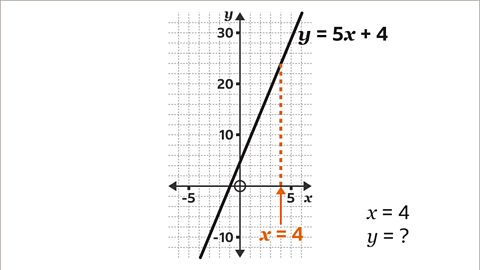
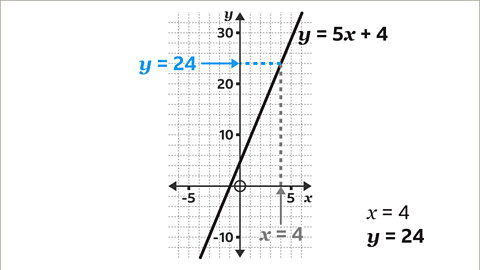
Image caption, Use the graph to find the value of ùíö when ùíô = 4
1 of 6
Question
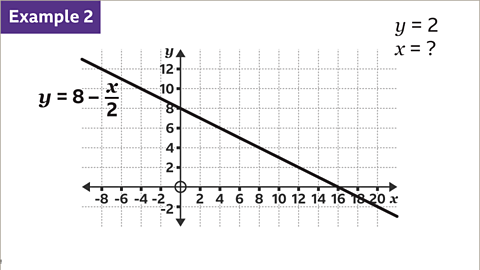
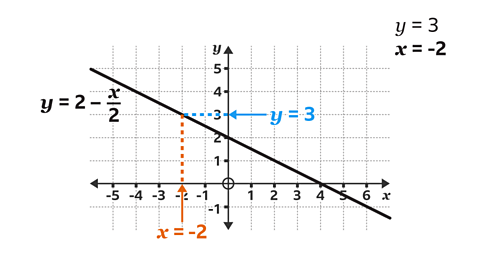
Use the graph to find the value of \(x\) when \(y = 3\)
On the \(y\)-axis, locate the given amount (3) and draw a horizontal line, using a ruler, across to the line.
Draw a vertical line, using a ruler, from the line down to the \(x\)-axis and read the value on the \(x\)-axis.
When \(y\) = 3, \(x\) = -2
Practise reading and plotting linear equation graphs
Quiz
Practise reading and plotting linear equation graphs with this quiz. You may need a pen and paper to help you.
Real-life maths

Linear graphs are commonly used when converting between different units of measurement.
For example, swapping between temperatures in degrees Celsius (°C) and degrees Fahrenheit (°F), exchanging between different currencies, such as pounds and euros, or changing inches into centimetres.

Linear graphs are useful to pharmacists and scientists in the pharmaceutical industry when working out the correct strength of drugs.
The amount of a drug for a given volume of medicine is critical, both for the medicine to be effective and for the safety of the patient.
Game - Divided Islands
Play the Divided Islands game! game
Using your maths skills, help to build bridges and bring light back to the islands in this free game from ±´”„tv Bitesize.

More on Graphs
Find out more by working through a topic
- count6 of 7
- count7 of 7
- count1 of 7