Random sampling
Occurring without a pattern. Unpredictable. sampling is where each member of a population is equally likely to be selected. Possible methods include using a random number generator from a computer programme, rolling a number of dice or using the random number button on a scientific calculator.
Pulling names from a hat is a simple way of selecting a random sample.
Example
Jimmy has the following list of random numbers:
3 6 9 0 1 3 7 4 3 2 2 9 1 3 8 5 4 1 2 7
He wants to use them to choose four people from a list of 60.
First he groups the numbers into pairs:
36 90 13 74 32 29 13 85 41 27
He then removes numbers greater than 60, any repeat numbers, and 00.
36 13 32 29 41 27
Finally, he selects the 36th, 13th, 32nd and 29th people on the list.
Question
Michael wants to select a sample of ten people from a list of 70. Using the random number function on a calculator he gets the following numbers:
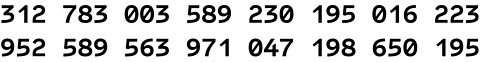
Which numbers should he use to form his sample?

So the numbers he should use are:
31, 27, 35, 23, 01, 62, 25, 56, 39, 04
Questionnaires
Most surveys are conducted using questionnaires.
There are many ways to conduct questionnaires, such as over the phone, face-to-face, by post or over the internet. The way in which questionnaires are conducted can have an impact on their reliability.
For example, a questionnaire that is collected face-to-face may give a lot of well-understood information, but this is a costly and time-consuming way to collect data. Data that is collected via post may be cheaper and quicker to collect, but many people may not post their questionnaires back so the sample size may be smaller.
Writing questionnaires
Questionnaires need to be easy to understand and unbiased. Bias is when one answer is favoured over another and can lead to unreliable results.
The way questions are worded is very important. All questions must:
- be easy to understand
- be unbiased
- be non-offensive
- allow every person to answer
Response boxes are the boxes on questionnaires that allow people to indicate their answer to a question. These boxes make it easier to collect data from the questionnaire once it's finished.
Examples
Here are some poorly worded questions.
- How much pocket money do you get per week?
- £1 to £4
- £5 to £8
- £8 to £10
This is not a good question to use as not all amounts are accounted for. Some people may get no pocket money and some people may get more than £10 per week. There is also a gap between the amounts in the first two responses, and an overlap between responses two and three. To make this question more suitable, name the first box '£1 to £4.99', the second '£5 to £7.99', the third to '£8 to 10.99', and include either a response box for '£0' and a response box for '£11 or more', or include a response box for 'any other amount'.
- How many films do you watch?
- a few
- a lot
- not many
This is a bad example of a question for two reasons:
- There is no time period given in the question, for example, 'per week' or 'per month'. This means people may answer the question differently depending on their interpretation.
- The response boxes are very vague. What represents a lot of films to one person may not be a lot to another. Use numerical amounts instead.
- Experts agree that Maths is the best subject at school. Do you agree that Maths is the best subject at school?
This is not a good question as it is biased towards Maths. Many people will not want to disagree with the person asking the questions, so the results may be unreliable. This is called a 'leading' question.
- In your opinion, what is the best way to improve our school?
This is an 'open' question. Think carefully about using this style of question in questionnaires. Inviting the respondent to write a sentence answer means it will be very difficult to collect, compare and analyse responses. This question could be improved by providing a small list of suitable answers to choose from and an 'other' box for any options not included.
Data collection sheets
Once questionnaires have been filled in and returned, the data that has been collected from them needs to be represented in either tables or diagrams so it can be easily understood. A data collection sheet makes this easy to do.
A data collection sheet has three columns. The first column contains the different possible data values. The second column is for a tally so that the data can be counted as you go along. The third column is for the total frequency for each data value.
The following questionnaire question can be represented using the data collection sheet below:
What colour is your car?
- white
- black
- grey
- red
- other
| Colour of car | Tally | Frequency |
|---|---|---|
| white | ||
| black | ||
| grey | ||
| red | ||
| other |
More on M1: Handling data
Find out more by working through a topic
- count3 of 6