The stages of geographical fieldwork enquiry
Stage 1: Introduction and planning
Title
Aims stated
Hypothesis devised
Selection of suitable location
Risk Assessment
Stage 2: Fieldwork techniques and methods
Primary data collection
Secondary research
Risk management
Stage 3: Data Processing and presenting
- Data Presentation
Stage 4: Analysing and Interpreting data
Data Analysis
Data Interpretation
Stage 5: Conclusions/Evaluation
Hypothesis (accepted or rejected)
Geographical conclusion
Evaluation
Planning
Planning an enquiry:
Identify questions or issues for investigation.
Develop one aim.
Develop a minimum of two appropriate hypotheses.
1. Identifying questions or issues for investigation.
The first stage is to identify a topic. The issue or questions should relate directly to something covered in Unit 1 or 2.
| Unit 1: Physical geography | Unit 2: Human geography | |
|---|---|---|
| Examples | Rivers | Population change |
| Coasts | Migration | |
| Weather | Land use | |
| Rocks | Changes to the inner city | |
| Urbanisation | ||
| Development | ||
| Managing our resources | ||
| Tourism |
A popular topic for investigation is Rivers.
Potential title: A study of how river features change downstream.
2. Develop one aim
The aim is the overall goal or target that a piece of fieldwork will reach.
Aim: To test the changes that happens within a river from the upper to lower course in the river.
3. Develop a minimum of two appropriate hypotheses
A hypothesis is a statement that will be tested through the fieldwork investigation. It should be linked to geography theory.
Hyp 1: The cross-sectional area of the Glenarm River increases with distance from the source.
Hyp 2: The bedload size will decrease and the bedload shape will become more rounded as the river flows downstream.
Primary and secondary sources
Primary sources - data collected first hand.
Secondary sources - data from other sources such as maps, texts or census.
Information collected in the field for the rivers fieldwork will be primary information.
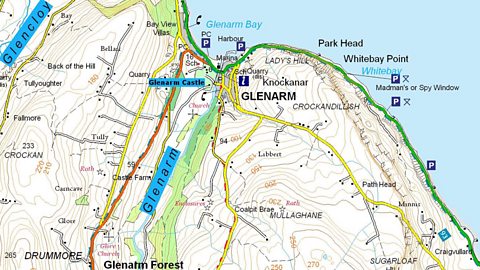
Maps used to plot the different sites along the course of the river where the measurement of the results would be taking place will be secondary information.
Risk assessment
A risk assessment is required to identify potential risks involved in fieldwork and how they can be reduced.
Rivers can be very dangerous. Before entering the water you should check that the water levels and velocities are safe.
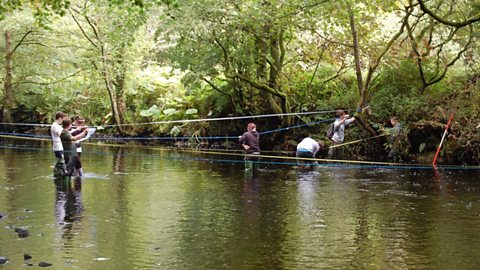
Safety equipment for crossing a river:
Waders - long boots that keep your feet and legs dry and provide stability in the water.
Ranging poles - useful for keeping you steady as you move in the river.
Safety rope - a rope tied about 1m above the surface of the water to give you something to hold onto as you cross the river.
Other equipment:
First Aid kit
Emergency whistle - can be blown to attract attention in an emergency.
Bivvy bag - useful to carry an injured person or to act as a shelter in extreme weather.
Mobile phone - useful for contacting the emergency services.
Fieldwork techniques and methods
There are many different techniques that can be used in geography fieldwork.
Select appropriate data collection methods that will be clearly linked to the specific aims and hypotheses stated.
Identify the equipment that would ensure results are both accurate and reliable.
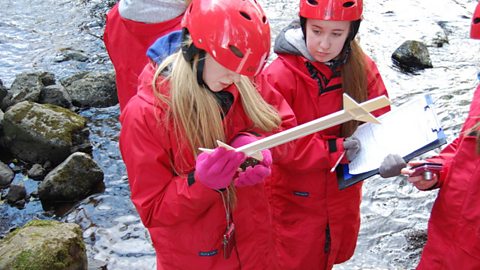
Recording sheets are used to make note of a range of measurements and observations at a number of locations.
Hypothesis 1
Hyp 1: The cross-sectional area of the Glenarm River increases with distance from the source.
In order to investigate the cross-sectional area of a river you must visit 5 different sites from the upper course, middle and lower course.
Equipment: Metre ruler, long tape measure
Measuring the cross section: measure the width of the channel and the depth of the channel.
Channel width (m): Stand with your back to the source (upstream) stretch the tape measure from the right river bank to the left river bank, ensuring that the tape is at least 1m above the surface of the water. Measure the width of the river from the inside of the right bank edge to the left bank edge.
Channel depth (m): Keep the tape measure stretched across the width of the river. Use the metre ruler to record the depth of water from the river bed to the surface of the water. Start from one river bank and move at 30cm intervals across the river.
Cross sectional area (CSA) (m2) This is a simple calculation to measure the amount of water at each site (the cross sectional area of the water).
CSA(m2) = width (m) x average depth (m)
Example of recording sheet for width and depth measurements
| River site | Channel width | Near bank (0cm) | 30cm | 60cm | 90cm | 1.2m | 1.50m | 1.80m | 2.10m |
|---|---|---|---|---|---|---|---|---|---|
| Site 1 | |||||||||
| Site 2 | |||||||||
| Site 3 |
| River site | 2.40m | 2.70m | 3.00m | 3.30m | 3.60m | 3.90m | 4.20m | 4.50m | 4.80m |
|---|---|---|---|---|---|---|---|---|---|
| Site 1 | |||||||||
| Site 2 | |||||||||
| Site 3 |
| River site | 5.10m | 5.40m | 5.70m | 6.00m | 6.30m | 6.60m | 6.90m | 7.20m | 7.50m |
|---|---|---|---|---|---|---|---|---|---|
| Site 1 | |||||||||
| Site 2 | |||||||||
| Site 3 |
Hypothesis 2
Hyp 2: The bedload size will decrease and the bedload shape will become more rounded as the river flows downstream.
In order to investigate the changing bedload size and shape in the river you must visit 5 different sites from the upper course, middle and lower course.
Equipment: Metre ruler or callipers, copy of Powers Index of Roundness.
The aim of this is to measure the size and shape of a sample of stones from each site visited in the river.
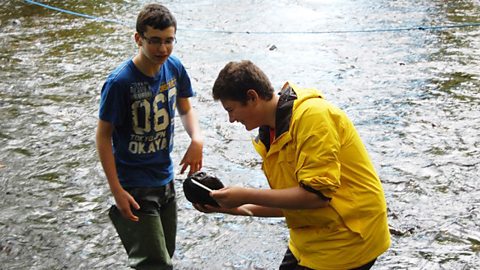
At each site along the river move across the river and select 20 different stones found at the river bed. You should use a random method of collection – put the metre ruler into the water and pick up whatever stone it is touching.
Use the ruler or callipers to measure the long axes of each stone (the longest two points on the stone) – this should be recorded in cm.
Use the Powers Index of Roundness to observe and compare the shape of the stone and record this.
Example of recording sheet for bedload size and shape:
| Stone number | 1 | 2 | 3 | 4 | 5 | 6 | 7 | 8 | 9 | 10 |
|---|---|---|---|---|---|---|---|---|---|---|
| Long axis length | ||||||||||
| Shape of stone |
| Stone number | 11 | 12 | 13 | 14 | 15 | 16 | 17 | 18 | 19 | 20 |
|---|---|---|---|---|---|---|---|---|---|---|
| Long axis length | ||||||||||
| Shape of stone |
Secondary source - map of the Glenarm river area map to help locate the different sites.
Processing and presenting data
Once fieldwork data has been collected, the information must be processed and presented. This is where you make sense of your findings and present them so that the reader can see them clearly
Presentation methods include:
| Graph types | Maps | Photos and diagrams |
|---|---|---|
| Bar graph | Sketch map | Sketch/diagram |
| Histogram | OS map (annotated) | Photograph (annotated) |
| Line graph | Choropleth map | |
| Scatter graph | ||
| Pie chart | ||
| Cross-section |
Hypotheses 1 and 2
Hyp 1: The cross-sectional area of the Glenarm River increases with distance from the source.
Data could be displayed in a number of ways:
Draw a series of cross-sections.
Present data using bar charts.
The difference in the cross sectional area can be shown using a range of graphs for each site to show the depths measured across the width of the river.
Graph 2: The cross section area for Site 1 at the Glenarm River
Hyp 2: The bedload size will decrease and the bedload shape will become more rounded as the river flows downstream.
Data can be displayed in a number of ways.
Bar chart to illustrate the average bedload shape or average size of stone at each site.
Scatter graph to measure the size and shape of the bedload.
Graph 3: Bar graph showing the average bedload size for the Glenarm River

Presentation methods:
A histogram is usually used to display continuous data (e.g. over time) and will have the blocks touching each other.
Bar graphs are usually used to display discrete or non-continuous data and each block will be separated with a space.
Scatter graphs usually involve two different variables and can be used to test the strength of the relationship (or correlation) between the two variables.
Once the graph has been drawn, the strength of the relationship can be tested using a line of best fit/trend line. This enables geographers to look for a positive, negative or no correlation between the two set of variables.
Analysing and interpreting data
Analysing fieldwork data
Analysis involves describing results in each graph or resource.
Describe what data was used to help create the graph.
Quote figures. What are the highest result/lowest results?
Ensure units are used when quoting figures e.g. cm, m, km
Describe any patterns or trends.
What are the relationships that the graph presents?
Interpreting fieldwork data using knowledge of relevant theory and/or case studies
Data interpretation involves explaining the different reasons for the results/graphs that have been presented.
Explain the patterns and trends in the information and:
Go back to the hypothesis that is being tested.
Explain the results that help to either support, prove or disprove the stated hypothesis.
Refer to particular geographical theory and specifically note the role that the theory might have played in linking with the hypothesis.
Make good use of key terms relating to the theory.
Identifying anomalies in the fieldwork data
Describe and explain the potential reasons for any unusual results.
Hyp 1: The cross-sectional area of the Glenarm River increases with distance from the source.
Data Analysis
Graph 1 shows the average channel depth as you move downstream.
The graph clearly shows that the average channel depth actually decreases as you move further upstream.
Site 4 is found high up in the upper course of the river and has an average depth of 0.21m whereas the deepest part of the river is found at Site 1, in the lower course where the depth is 0.62m on average.
Data Interpretation
Graph 1 shows that part of the depth measurements that help make up the cross-sectional area of the river are decreasing as we move upstream.
The amount of water in the river increases closer to the mouth of the river (site 1).
Geographical theory: Attrition, Hydraulic Action, Corrasion and Solution all work to different levels to increase the width and depth of the river channel.
There is a lot more water in the river by the lower course (site 1). There will be more potential for abrasion and hydraulic action which will continue to increase the cross-sectional area at this point.
At site 4 in the upper course, there is much less water so the erosion will usually only be eroding down and not across.
Drawing conclusions and evaluating
Drawing evidenced conclusions:
Return to the stated hypotheses.
Write a statement about what evidence supports how strongly the hypothesis is found to be true or false.
Note which element of geographical theory is linked to the fieldwork.
Any unusual results should be acknowledged and, if possible, explained.
Evaluating the fieldwork
An evaluation involves:
Describing data collection methods, including any equipment used.
Identifying problems with data collection method.
Identifying limitations of the data collected.
Suggesting other data that might be useful.
Evaluating conclusions.
Suggesting how to extend the scope of the study.
The final evaluation should explain any problems encountered when collecting data:
Was the right equipment used?
Could the data collection have been improved?
Is there other equipment available that might have made data collection more efficient or accurate?
Should more data have been collected?
Should more sites have been visited?
Were the right sites visited?
Are there any other measurements that might have been useful?
Evaluating conclusions:
Were the conclusions a fitting reflection to the aims and hypotheses stated in the coursework?
Did the study help to answer questions on this?
Was this a good title/ aim in the first place?
Were the hypotheses specific enough to be able to be assessed easily?
Was the location for the study appropriate?
If you were to repeat this study again – how could you have improved the accuracy of the results?
Preparing the fieldwork statement and table of data
The fieldwork statement must include:
a title
a statement of the aim and hypotheses that the candidate is testing
details of the location of the study (including a map, if appropriate)
The table of data must include:
primary data essential for investigating the aim of the study (include secondary data, if relevant)
data collected for all variables relevant to the aim
quantitative data (numerical scores) to allow for graphical representation representation (include qualitative data if relevant)
normal conventions, such as a title, and all variables clearly stated, along with their precise units of measurement
You are expected to use ICT to present your fieldwork statement and your table of data, at the end of the examination, attach your fieldwork statement and table of data to your script along with a completed cover sheet.