Before starting this guide, it may be helpful to read the guide from .
Key points
Happening at the same time. equations are two or more equations that share An unknown value, usually represented by a letter like ØÆÖ or ØÆÜ.
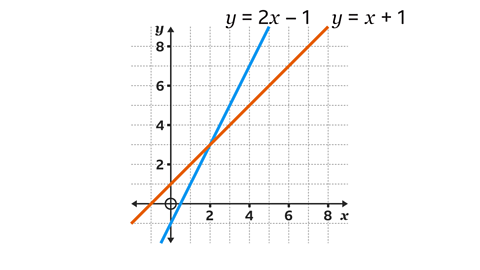
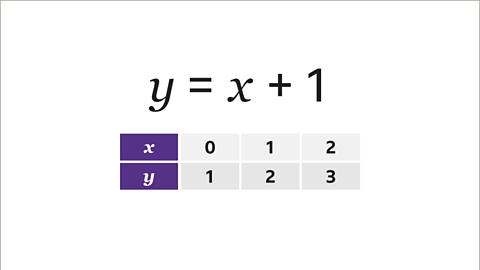
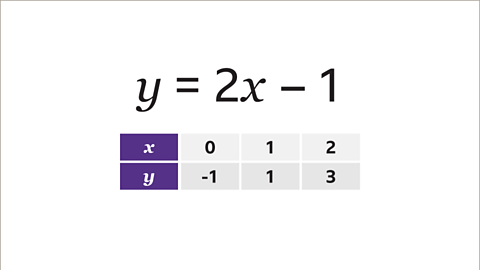
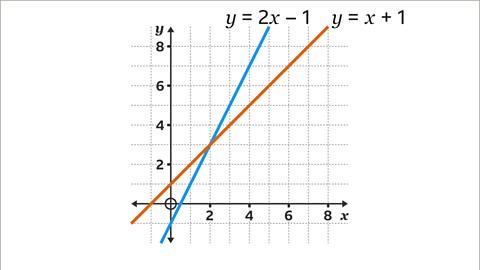
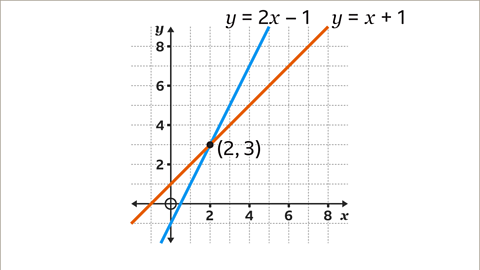
For example, \(y\) = 2\(x\) - 1 and \(y\) = \(x\) + 1 share the variables \(x\) and \(y\). They are simultaneous because the equations are solved at the same time.Simultaneous equations can be solved algebraically or graphically.
To solve simultaneous equations graphically, it is essential to be able to draw the graph of a straight line.
Representing equations graphically
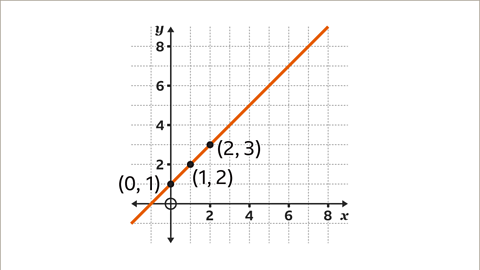
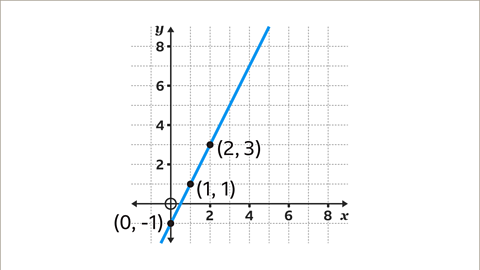
Each equation is used to create a table of values, which are then plotted as The ordered pair of numbers (ØÆÖ, ØÆÜ) that defines the position of a point. pairs on the same set of Two reference lines, one horizontal and one vertical, that cross at right-angles. They are used to define the position of a point on a grid. Axes is the plural of axis. .
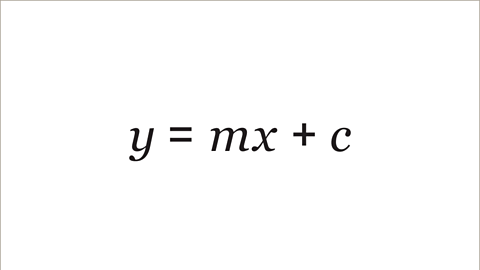
Graphs are often written in the form \(y\) = \(mx\) + \(c\), where \(m\) is the A measure of the slope of a line. The steeper the line, the greater the gradient. The gradient is represented by ØÆÄ in the equation ØÆÜ = ØÆÄØÆÖ + ØÆä (how steep the line is) and \(c\) is the \(y\)-The point at which the line crosses the ØÆÜ-axis. Commonly referred to as ŌĆśthe interceptŌĆÖ..
If the two lines cross, then the coordinates of this Where lines cross or overlap. are the solutions to the simultaneous equations. If the lines are parallel (and therefore do not intersect), there is no solution.
Example
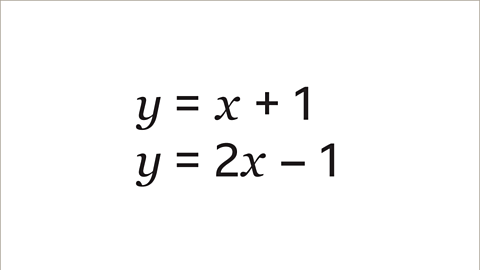
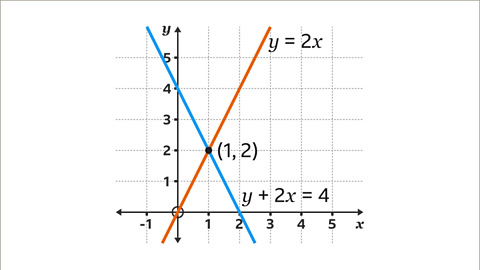
Image caption, Use the graphical method to solve the simultaneous equations.
1 of 8
Question
What is the solution to the pair of equations \(y\) = \(x\) + 3 and \(y\) = 2\(x\) + 1?
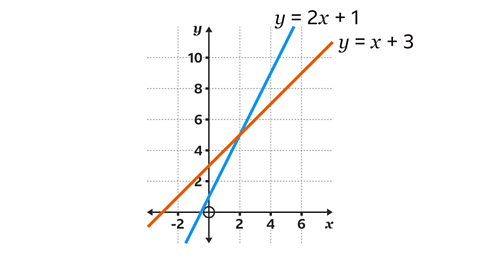
The two equations have been drawn as linear graphs.
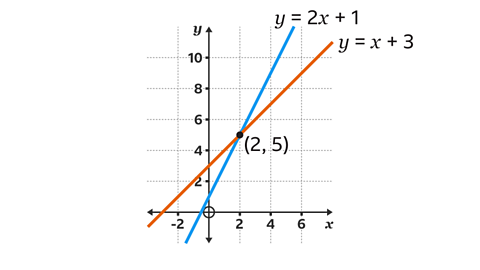
The point of intersection is (2, 5)
The solution to the pair of equations is \(x\) = 2 and \(y\) = 5
Rearranging equations to solve problems
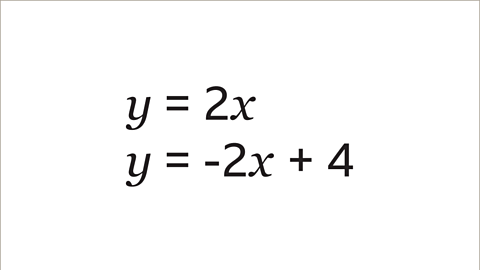
To be able to solve simultaneous equations, both equations need to be in the form \(y\) = \(mx\) + \(c\)
If the equations are not in the form \(y\) = \(mx\) + \(c\), the equations need to be rearranged.
Example
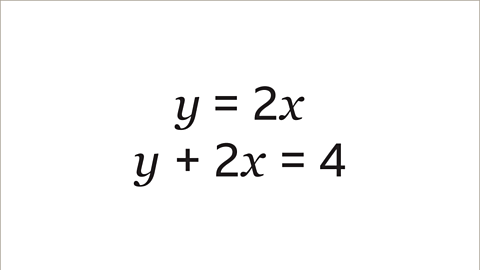
Image caption, Use the graphical method to solve the simultaneous equations.


1 of 7
Question
What is the solution to the pair of equations \(y\) = \(x\) + 5 and \(y\) = 7 ŌłÆ \(x\)?
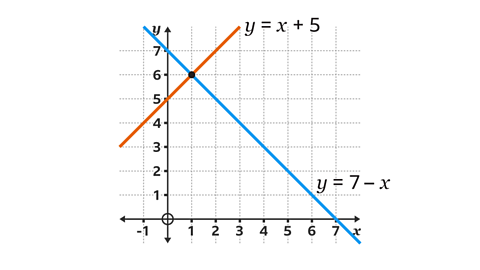
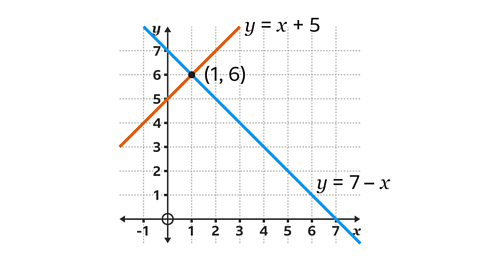
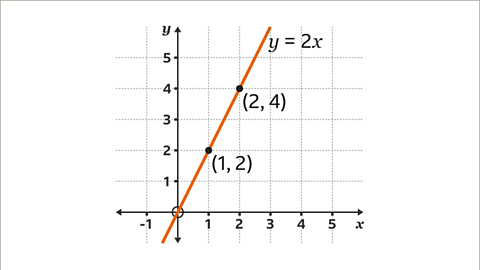
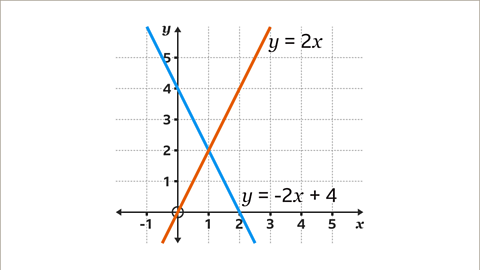
The two equations have been drawn as linear graphs.
The point of intersection is (1, 6).
The solution to the pair of equations is \(x\) = 1 and \(y\) = 6
Real-life maths
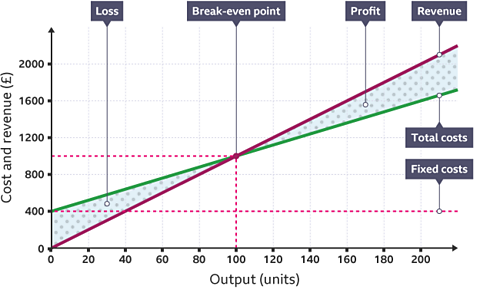
A company will use graphs of simultaneous equations to model the potential profits it can make by selling its products at a different price. The company will have fixed costs and A quantity that can take on a range of values. costs, depending on how much of something it produces.
The money a company earns from the sale of its products and services. will be made by multiplying the sale price by the number of units sold. Where the two lines on the graph intersect will be the ŌĆśbreak-evenŌĆÖ point (the number of sales needed before the company begins to make a profit). Using a spreadsheet, the company can make financial decisions, including the profits they might make or the effect of lowering (or raising) the price of what it sells.
Test yourself
More on M6: Algebra
Find out more by working through a topic
- count1 of 5