What is a pictogram?

A pictogram is a chart that uses pictures or symbols to represent data so you don’t have to look at lots of numbers.
You have to read pictograms carefully so you understand what the symbols mean.
All pictograms should have a key. A key shows you what each symbol represents.
Example 1
Take a look at this pictogram. It shows how many cars a salesman sold during a week.
The key on the right shows you that each circle represents 10 cars.
A pictogram to show how many cars a salesman sold during the week
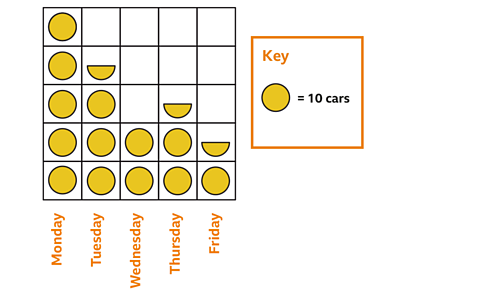
How many cars were sold on Wednesday?
Wednesday has 2 circles so:
10 + 10 = 20 cars
How many cars were sold on Thursday?
A semi-circle represents 5 cars, because that is half of 10.
10 + 10 + 5 = 25 cars
Example 2
Take a look at this next pictogram.
The key shows that one star represents 8 points. A half star must represent 4 points, since it is half of the whole.
A pictogram to show the number of house points collected in a school
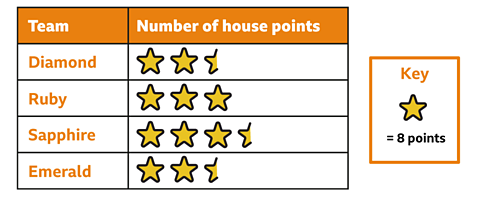
How many points did Sapphire win?
The pictogram shows that Sapphire have 3 full stars and a half star. You can use the key to work out how much this is in total:
8 + 8 + 8 + 4 = 28 points
How many more points did Ruby win than Emerald?
For this question, you will have to subtract once you have worked out how many points each house won.
Ruby were awarded 24 points. Emerald were awarded 20 points.
24 - 20 = 4 points
Watch: Pictograms
Gordon the crow is in charge of a bird table. Watch the video below to find out how a pictogram can help him manage his stock.
Activities
Quiz 1
Class P went on a school trip to the zoo. After they had visited, they created a pictogram of their favourite animals. Have a go at this quiz to find out more.
Activity 2
You will need a piece of paper and pen for this activity
Class P are adding up their class team points for the past 5 weeks and creating a pictogram to show the results! Using the table below, can you fill in the missing numbers and create a pictogram?
| Team | Week 1 | Week 2 | Week 3 | Week 4 | Week 5 | Total |
|---|---|---|---|---|---|---|
| Ruby | 20 | 60 | 10 | 15 | 20 | 125 |
| Emerald | 20 | 10 | 10 | 25 | 50 | ? |
| Sapphire | 30 | 20 | 40 | ? | 30 | 130 |
| Diamond | 40 | 10 | 25 | 20 | 25 | ? |
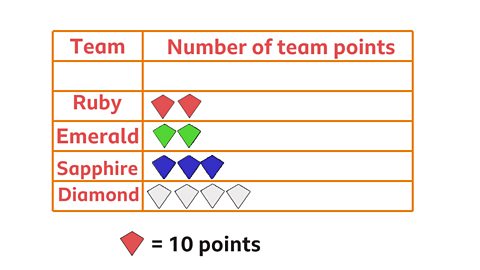

Always remember to read the key!
Quiz 2
Have fun using pictograms with this quiz.
NEW! Play Guardians: Defenders of Mathematica - the Halloween update. game
Experience Mathematica as you’ve never seen it before, with all-new backgrounds and costumes for Halloween. Available for a limited time only. Use your maths skills to save the day before it's too late!
More on Tables, graphs and charts
Find out more by working through a topic
- count7 of 8

- count8 of 8
- count1 of 8
- count2 of 8