Tables, graphs and charts
How can data be displayed?
Learn about some different ways to visualise data.

Pictograms
Learn how to use and interpret pictograms, charts that use pictures or symbols to represent data.

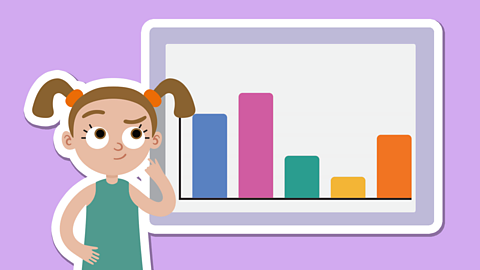
Bar charts
Learn how to read and interpret bar charts.
