A Venn diagram shows the relationship, in a visual way, between groups of different things.
They are used in many areas of life to classify items as well as highlighting similarities and differences.

Solving problems with Venn Diagrams
Example
A class of children were asked if they play football or swim.
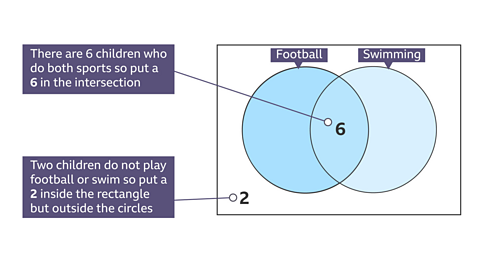
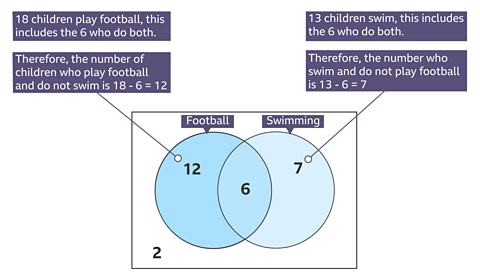
18 said they play football, 13 swim and 6 play football and swim.
Two children do not play football or swim.
- How many children are in the class?
- How many children do not play football?
Drawing a Venn diagram makes answering this type of question easier.
Start by drawing a rectangle containing two intersecting circles as there are two sports.
Label one football and the other swimming.
Using the Venn diagram to answer the questions
To find the total number of children add all the numbers inside the rectangle together.
- The total number of children in the class is 12 + 6 + 7 + 2 = 27
To find the number of children who do not play football cover up the circle with football and add the other numbers.
- The number of children who do not play football is 2 + 7 = 9

How many pupils study Chemistry?
How many pupils study History but not Chemistry?
How many pupils are in the year group?
- How many pupils study Chemistry?
42 + 14 = 56 - How many pupils study History but not Chemistry?
26 - How many pupils are in the year group?
26 + 42 + 14 + 18 = 100
Question
In a survey, 200 customers were asked their views on being an ethical consumer.
89 customers said they like to buy Fairtrade products when they can.
131 customers preferred to buy local products.
45 customers were keen to buy products from both the Fairtrade and the local range.
The remaining customers had not considered either Fairtrade or locally produced products.
How many customers had not considered either?

- Fairtrade and Local Produce
44 + 45 + 86 = 175 - 200 (customers) – 175 = 25.
- 25 customers had not considered either.
Test yourself
More on M2: Handling data
Find out more by working through a topic