Globally, our climate is always changing but it has been doing so much more quickly over recent decades.
Natural climate change can happen over thousands of years. Climate change caused by human activity has happened much more recently and is having much more sudden impact.
Evidence for climate change can be found from many different sources. These can provide information about climate conditions over different periods of time. More recent data clearly shows that the global climate is becoming hotter.
Rocks and fossils
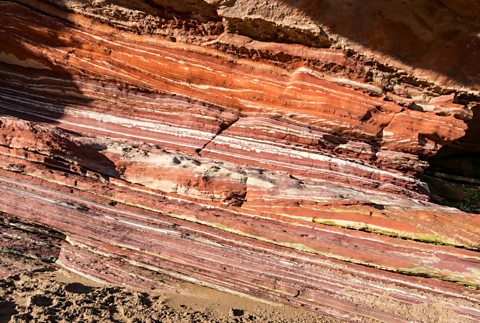
Rocks and fossils can be studied for information covering thousands and even millions of years.
Sedimentary rocks like sandstone and limestone are made from layers of sand, silt, soil and other material. These layers build up year by year and become compressed into rock.
The depth of the layers and the material they are made show what local conditions were like and how they have changed.
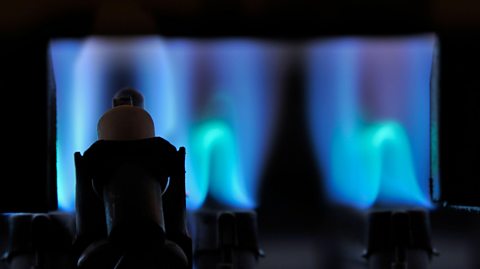
Ice cores
Arctic and Antarctic ice sheets build up in layers of annual snowfall. The snow becomes compacted and hardens, trapping air in the layers of ice.
When scientists take a core of ice it reveals the amounts of different gases in the atmosphere at that time. They can use this information to calculate the temperature of each year for the past 400,000 years.
Scientists who study the ice cores say there is clear evidence that there has been a rapid increase in temperature in the past decades.
Studying ice cores to investigate long-term climate change
Pollen analysis
Samples of soil cores contain traces of plant pollen that have been preserved in sediment.
Different types of plant are adapted better to different conditions so the amounts of different types of pollen can show changes in the type of vegetation in a particular area.
This provides a guide to what the climate was like at different times.
Tree rings
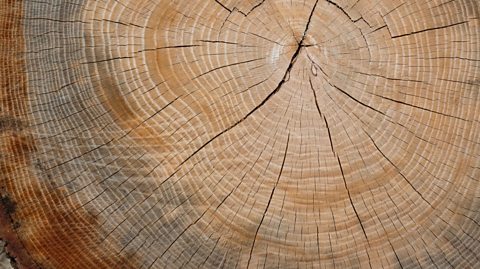
Tree ringsTree trunks grow wider in rings. Every year a new ring grows around the old rings.
The width of the ring depends on the temperature, rainfall and amount of sunshine that year. Years that are cold, when summers are very cloudy, or when there is too much or too little rain will result in thinner rings. Droughts might mean the tree barely grows at all.
Examining tree rings can show how old the tree is and how the climate varied between different years. Some trees can live for hundreds of years. In the UK, oak trees that are over 800 years old have been used to see what the climate was like centuries ago.
Ice sheets
Areas such as Greenland and the Arctic have seen thinning of ice sheets and shrinking ice caps.
Warmer summer weather causes the Arctic ice cap to melt and shrink each year, before the colder weather of autumn and winter causes it to grow again.
Satellites have been used to monitor changes in sea ice since 1979. In 2020, Arctic sea ice reached its minimum size for that year at 3.74 million square kilometres. According to scientists at the National Snow and Ice Data Centre (NSIDC), this is the second lowest since satellite records began over 40 years ago.
This visualization shows the expanse of the annual minimum Arctic sea ice for each year from 1979 through 2020, with a graph overlay. Credit: NASA/Goddard Space Flight Center Scientific Visualization Studio. The Blue Marble data is courtesy of Reto Stockli (NASA/GSFC).
Glaciers
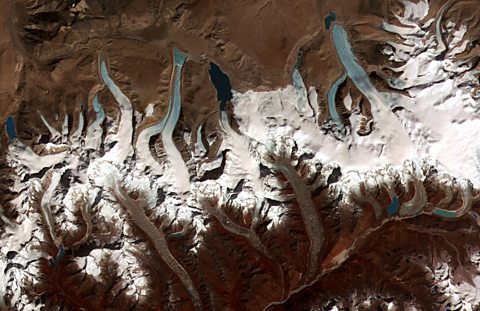
Photographs, satellite images and staking the changing position of the end of a glacier show that many mountain glaciers have retreated over the last 50 years.
This information could be partly due to a lack of snowfall as well as glaciers melting due to increasing temperatures.
Ocean acidification
Ocean acidity can be used to work out carbon dioxide levels in the atmosphere,
When carbon dioxide levels in the air increase, the amount of CO2 that dissolves into the oceans increases. This makes the water more acidic.
Current ocean acidity can be measured directly. We can work out how acidic oceans were in the past by comparing the thickness of seashell samples. Seashells are made of calcium carbonate, which is soluble in acid, so thinner samples suggest more acidity.
Since the beginning of the Industrial Revolution, the acidity of surface ocean waters has increased by about 30%. This increase is the result of humans emitting more carbon dioxide into the atmosphere and hence more being absorbed into the ocean.
Temperature records
Since the mid-19th Century, records of temperature around the globe have been recorded and kept. These give us an understanding of how the climate has changed over the last two centuries.
When we compare data from weather stations, weather balloons and satellites, with these earlier records, we can see a very accurate picture of trends in rising temperatures.
More on Climate change
Find out more by working through a topic
- count3 of 3