Watch: Calculating the mean, mode and median
What is the median?
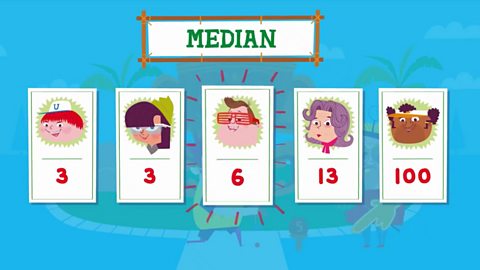
The median is the middle value.
To find the median, order the numbers and see which one is in the middle of the list.
3, 3, 6, 13, 100
The median is 6.
If there are two middle values the median is halfway between them. This might not be a whole number.
What is the mode?
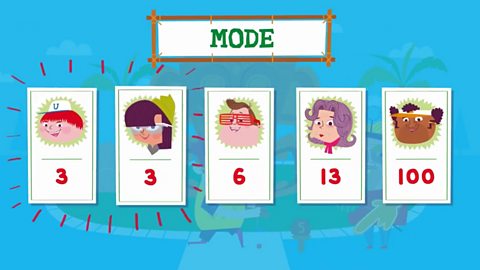
The mode is the number that appears the most.
To find the mode, order the numbers lowest to highest and see which number appears the most often.
3, 3, 6, 13, 100
The mode is 3.
What is the mean?
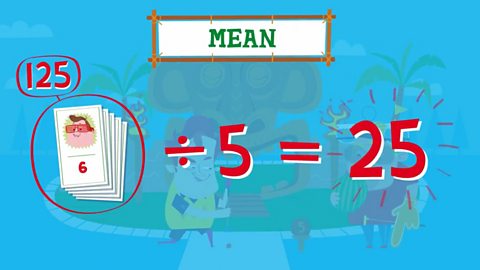
The mean is the total of the numbers divided by how many numbers there are.
To find the mean, add all the numbers together then divide by the number of numbers.
6 + 3 + 100 + 3 + 13 125
125 √∑ 5 = 25
The mean is 25.
The mean is not always a whole number.
What is the range?

The range is the difference between the biggest and the smallest number.
To find the range, subtract the lowest number from the biggest number.
3, 3, 6, 13, 100
100 - 3 = 97
The range is 97.
Activity 1
Activity 2
NEW! Play Guardians: Defenders of Mathematica - the Halloween update. game
Experience Mathematica as you’ve never seen it before, with all-new backgrounds and costumes for Halloween. Available for a limited time only. Use your maths skills to save the day before it's too late!

More on Processes in mathematics
Find out more by working through a topic
- count33 of 33
- count1 of 33

- count2 of 33

- count3 of 33