Why is data useful?

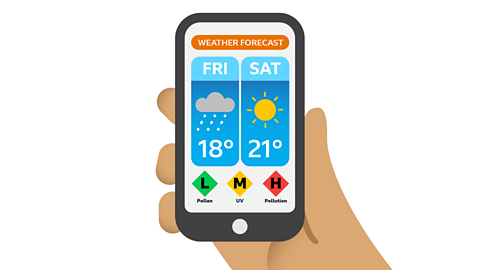
Information collected in the form of numbers. is very useful. It can help us to answer questions, make decisions and solve problems.
Before we can use data it needs to be collected.
Have you ever been a patient in a hospital?
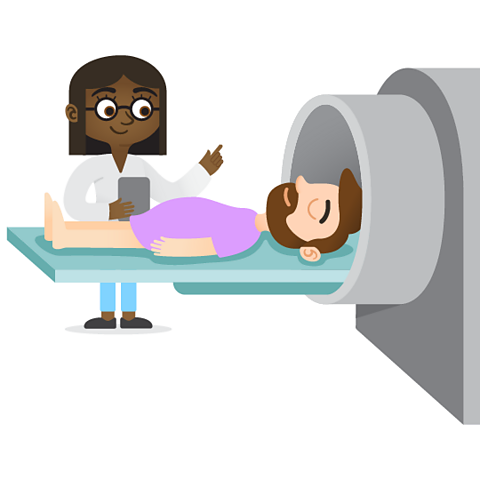
If you have, the hospital would have collected some of your data. This might have been:
- your name
- your age
- your weight
- any allergies you have
The hospital will use this data to help look after you.
How can we use data with computers?

When we collect data we can store it in a computer.
We can create a A way of showing and organising information in rows and columns. to add the data into.
We can also use a piece of The programs and information that help a computing device work properly. called a spreadsheet that stores and uses data.
How are spreadsheets organised?
Let's take a look at a spreadsheet Isabelle is using to see how much of each type of fruit she is eating every week.
Spreadsheets are made-up of a number of different parts.
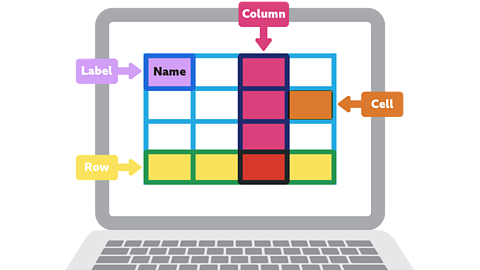
- Cells - the place where a single piece of data is stored.
- Columns - contain data about the same thing, like the number of bananas eaten.
- Rows - contain the data for one record, like the number of different fruits eaten by Isabelle.
- Labels - show us what the data means and who it belongs to.
How do we use a spreadsheet?
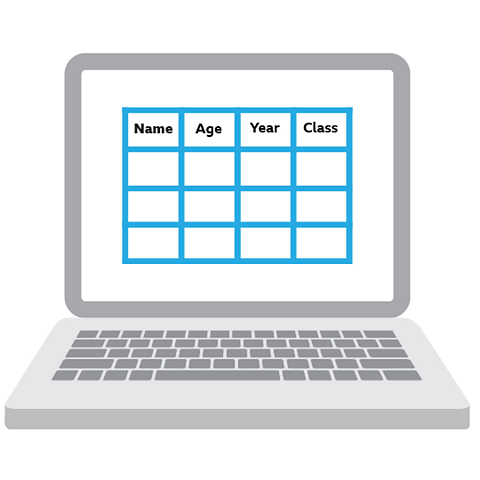
We can get our spreadsheet ready before collecting any data. We can put labels on the columns so we know which cells to put our data in. When we add our data to a spreadsheet we can use it for different things.
One very useful thing we can do is display the data as a chart or graph. We select the data we want to use, then select the type of graph we want the data displayed in.
A computer can quickly create a chart or graph from our data. It can create a chart or graph much quicker than a human can.
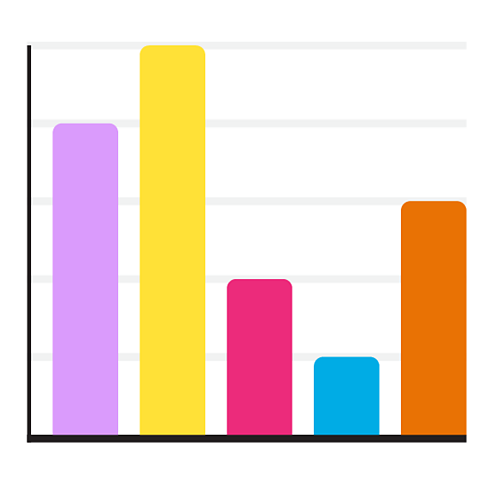
Charts and graphs allow us to identify patterns in our data. This is because patterns are easier to see when data is displayed in this way.
It's more difficult to see the same patterns when the data is displayed in a table.
Charts and graphs created by spreadsheet software can help answer our questions. We can also use charts and graphs to present our data to other people.
What are the different types of charts and graphs?
Spreadsheets can help us create different types of charts and graphs. We should pick the type of chart or graph best suited to our data.
Explore more about the different types of charts and graphs below.
How else is data used?

Supermarkets collect a lot of data to help them. They know how many items are on the shelves and when new items need to be added.
They can use the data to work out which items sell best at different times of year. This allows them to order extra items when they are needed.
Activities
Computing - Dance Mat Typing. game
Build and test your computing skills with different levels of touch type challenges

More on Information technology
Find out more by working through a topic
- count9 of 17

- count10 of 17
- count11 of 17
- count12 of 17