Real life graphs
A graph can be used in real life situations to help with working out quantities, often costs.
Example
Question
The graph below shows the cost of buying a pizza with a number of different toppings.
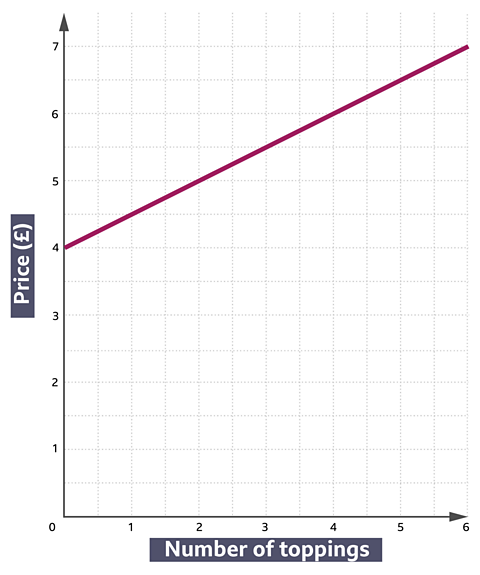
Neve wants a pizza with olives, peppers, mushrooms and cheese. How much will this cost?
Solution
Neve chooses four toppings.
Rule across from 4 on the x-axis until you meet the line, and then rule across to find the price.
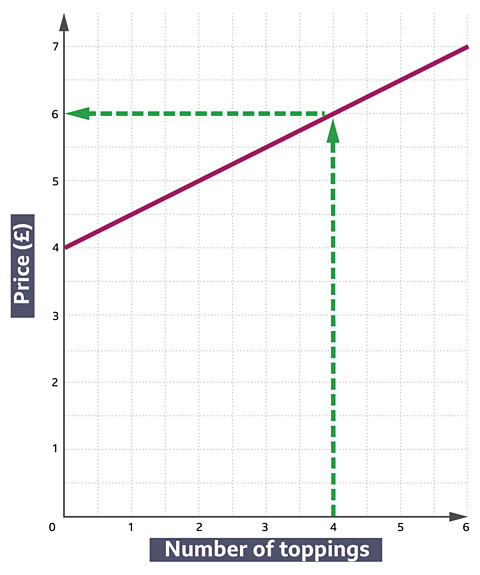
Answer
A pizza with four toppings will cost ÂŁ6.00.
Question
Ross spends ÂŁ5.50 on a pizza. How many toppings did he choose?
Solution
Rule across from ÂŁ5.50 from the y-axis until you meet the line, and then rule down to find the number of toppings.

Answer
Ross chose three toppings for his pizza.
More on M1: Algebra
Find out more by working through a topic
- count1 of 7
- count2 of 7
- count3 of 7