

Last month the ����tv celebrated 20 years of its online presence. ����tv Research and Development was at the forefront of this venture into the unknown all those years ago, and so it seemed fitting that we were approached to contribute to an artistic celebration of this milestone, as part of a collaboration with ����tv Future Media.
It's hard to believe that it's been since the ����tv Networking Club website was launched alongside a ����tv Two series called The Net; a programme which included, amongst other things, information about “electronic mail”! You can watch a great clip from the show here.
As you might expect, R&D is very proud of our leading role in this very important early work, which lay the foundations for the way we experience ����tv Online today. Our Chief Scientist, Brandon Butterworth, wrote a great blog post all about the early days of ����tv Online for the tenth anniversary of bbc.co.uk, which still makes for a very interesting read. There is also a fantastic new covering this period as well.
Twenty years on, we’ve been taking a trip down memory lane. We were asked to contribute to a visual celebration of ����tv Online, to help mark this anniversary. The overall idea was to create a visual representation of the way ����tv Online has evolved over the last two decades; from its humble beginnings right through to the present day. The result can be viewed by following the link below.
: 20 years of the ����tv on the web, as told through the life cycles of its directories
Working with Historical Data
At the core of this visualisation are some historical statistics about the structure and usage of ����tv webpages. Thanks to some excellent forethought by Brandon, there still exists a record of some basic monthly usage statistics starting from August 1994. This data contains the names of the top level directories on the site, together with the number of requests for each one. Unfortunately, the data set was a little patchy in places, as a lot has changed over the years in terms of the structure of the site and the methods of reporting statistics. This was particularly noticeable in the case of the News and Sport pages. Our Producer, Scott Cawley, explains this well in his .
Piecing together this information is rather challenging, but we’ve managed to build a reasonably good picture of which pages appeared when, and the number of requests associated which each one. It’s been amazing to see how even this basic information can paint a picture of the evolving nature of ����tv online, as well as the wider, cultural milestones from the last twenty years. Whilst we’ve been as faithful to the raw data as possible, the aim of this project was to produce a conceptual interpretation to help tell the story of what is arguably one of the ����tv’s proudest achievements.
The earliest identifiable pages from 1994 and 1995 are an eclectic bunch. As well as a few pages relating to specific programmes (such as /tw for Tomorrow’s world) and services (/radio1 was the first radio station to have its own site in 1996) you can also spot /woodnorton – the site belonging to the ����tv Training facility in Evesham, and of course /rd is one of the first! Alongside these there are even a few pages named after individual people from R&D, which is a testament to the experimental nature of the ����tv’s foray into the web at the time, as well as the role that R&D had to play in it.
Other early pages include the first foreign language site /hungary, followed a few years later by a more coordinated launch of foreign language sites in 1998. Similarly, there’s a noticeable explosion of regional UK pages around 2001-2002.
Individual news stories pop out along the way, including /budget95 (Kenneth Clarke’s autumn budget), /election97, and /diana. These pages about individual stories become noticeably fewer as ����tv News online begins to take shape after late 1997, and the organisation of such pages changes.
Design and Implementation
The ideas behind the design and implementation of the visualisation itself are described here by the project's contributers.
, Data-centric Designer
As a freelance designer I mainly work with data in a variety of ways, ranging from data visualisation and information design to data art. Alongside Pete Warren, my role on this project was to explore ways of visualising the data we had available to us in order to capture the main themes of this important anniversary of bbc.co.uk. Initial themes of growth and movement from simplicity to complexity culminated in our final approach, guided by Pete's idea of using square symbols for the directories merging together. By referencing a pixel aesthetic, we wanted to illustrate how the site over time moved from being simple and 'low resolution' to 'high resolution'.
Pete Warren, ����tv Interaction & UX Designer / Sound Designer
Following initial brainstorm sessions and subsequent sketches of ideas from the team, Stefanie and I explored and developed ideas for visualising the evolution of ����tv web directories over 20 years. Our themes of pixels, resolutions, growth and gravity seemed to converge naturally and were further enhanced by Peter’s programming prowess. As the story panels, visualisation controls and a legend were added, the design elements were further aligned to reflect the ����tv’s online visual language. Alongside all the visualisation and data work being done by the team, I experimented with representing data events with sound. I was inspired by the simplicity of pixels and found the purity of arpeggiating sine waves complemented the multitudinous particles flying onto the screen. In addition, I wanted to sonically represent the ongoing evolution and longevity of the ����tv on the web, and this was achieved with a low tone which increased as the directories accumulated and aged over time. As a ����tv designer and sound designer with an interest in digital art, it was a great experience to work on a conceptual data-driven project and feel the complementary-skilled team members all pulling together to deliver something engaging and unique in a minimal amount of available time.
, Data Visualisation Designer & Developer
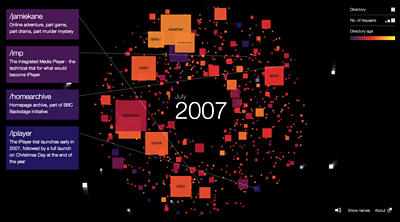
From a technical point of view, the challenge was to build an animation that was data driven (from directory requests within actual server reports), visually engaging, informative and would work both as a display piece and within a web browser. For good performance, we decided to use the HTML5 canvas element and pulled in bits of D3 and jQuery for specific tasks. Each directory is represented by a square particle, the motion of which is governed by simple pseudo-physics namely a force the pulls each particle towards the centre. The size of the particle is driven by the server report data: the more requests, the larger the particle. We decided to label just the directories with a larger number of requests to reduce clutter and designed a sidebar to dynamically show key events. Whilst developing the piece we had an option to show all the labels and we decided to leave this in as it provides another interesting perspective on the data.
We hope you take the opportunity to have an explore through the visualisation itself. It is fascinating how easy it is to chart the journey of ����tv Online just by digging through some raw statistics that have been sitting on a server, largely ignored for some years, and we are very pleased to be able to show them the light of day in this way.
The project team would specifically like to thank Alison Button, Colin Nesbit, Andrew Nicolaou and Joel Merrick for all their help behind the scenes.