
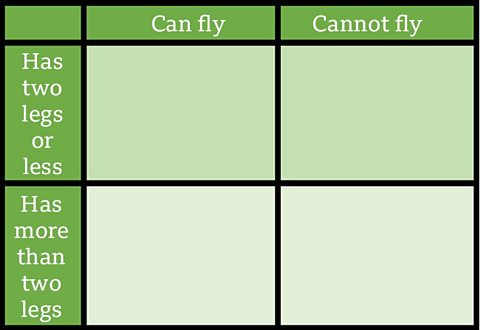
A Carroll diagram is a chart that helps us organise things into groups that are similar.
It is used to clearly show how objects can be organised into four different categories.
The left side and the top of the chart give the names of the individual options, and things are then placed into the appropriate group.
For example, if we are doing a task looking at animals which can and cannot fly, and those which have legs and those that don’t have legs, we can use a Carroll diagram to place each animal into the correct group.
What soup suits CAL's mood?
CAL likes his soups, but his tastes change depending on his mood!
Sometimes he likes certain combinations of ingredients, and on other days, he doesn’t.
In the video CAL wants a good way of deciding which soups are the best choice for his mood on any given day.
Sort the animals
Group the animals into the correct sections in the Carroll diagram. Do they have two or more legs? Can they fly or not?
Carroll diagrams are a useful tool to sort objects, numbers, shapes, etc. into categories.
More on Handling data
Find out more by working through a topic
- count3 of 6

- count4 of 6

- count5 of 6

- count6 of 6